
🏢 Institutional Real Estate Investors Databases – Campaign Ready! (2026 Edition)
Important Note For Readers: The database featured in this article is a limited-access resource intended exclusively for institutional clients. It is campaign-ready, fully updated as of April 2026, and designed for organizations initiating serious capital raises. This is not a general-purpose contact list – it is precision-built for institutional fundraising at scale.
April 2026 – ✍️ Written by Andrew Thomas – The Investors Link
Gain verified access to the world’s largest database of institutional investors actively allocating capital to real estate and real assets.
This exclusive dataset features 13,600 global institutions, fully updated for 2026, representing the most comprehensive coverage of real estate capital sources available.
🌍 What’s Inside
Each profile is drawn from verified institutional filings, fund commitments, and investor disclosures — delivering actionable, investment-grade intelligence for professionals raising or deploying real estate capital.
Investor Types Covered:
- Sovereign Wealth Funds
- Pension Funds (Public & Private)
- Insurance Companies
- Investment & Asset Management Firms
- Family Investment Offices
- Banks & Investment Companies
- Endowments & Foundations
- Superannuation Schemes
- Fund-of-Funds & Real Estate Fund Managers
- Infrastructure & Real Assets Investors
Unlike generic contact directories, this dataset isolates active allocators – institutions with confirmed real estate mandates, allocation programs, or property exposure.
Every contact is verified for activity, ownership, and sector relevance.
💼 Why It Matters
Institutional investors control the vast majority of global property capital.
This database provides direct visibility into the firms deploying equity into development projects, funds, joint ventures, and strategic real estate partnerships.
Ideal for:
- Fund Managers & Developers
- Investment Advisors & Placement Agents
- Institutional Capital Partners
- Private Equity Real Estate Professionals
📊 Database Details
- 13,600 Verified Institutional Investor Firms
- 16,400 Key Contacts – all with personal company emails – updated and cleaned in April 2026.
- Global Coverage: North America, Europe, Middle East, Asia-Pacific
- Structured by: Institution Type, Investment Focus, and Real Estate Allocation
- Format: Excel (.xlsx)
- Delivery: Manual dispatch within 24 hours of payment
- Payment Options: PayPal or Credit Card – No Refunds on Database sales
View the Database Details via the Video Below
🏢 Global Real Estate Fund Investors Database (2025 Edition)
Gain verified access to one of the world’s most exclusive and targeted databases of institutional Real Estate Funds – featuring over 4,000 global funds actively allocating to property, infrastructure, and related real assets.
Compiled from verified institutional filings and fund disclosures from 2022–2025, this dataset represents the most comprehensive, up-to-date coverage of institutional real estate capital worldwide.
🌍 What’s Inside
Each profile includes fund ownership details, AUM range, investment strategy, and geographic focus — sourced from confirmed institutional records.
It’s designed to provide actionable intelligence for professionals raising or deploying capital across the real estate value chain.
• Core, Value-Add & Opportunistic Real Estate Funds
• Private Equity Real Estate Platforms
• Institutional REITs & Fund Managers
• Pension & Insurance-Backed Real Estate Vehicles
• Sovereign Wealth-Linked Funds
• Endowment & Foundation Allocators
• Family Office-Managed Funds
• Global and Regional Fund-of-Funds
Unlike generic investor directories, this dataset isolates funds with confirmed real estate mandates and active deployment programs – not passive holders.
Every fund is verified for investment activity, sector relevance, and current portfolio exposure.
💼 Why It Matters
These institutional real estate funds are among the most sought-after capital partners worldwide.
This database enables direct engagement with the fund managers and decision-makers behind active real estate vehicles seeking investments, co-investment opportunities, and partnerships.
Ideal for:
• Developers & Fund Sponsors
• Capital Advisors & Placement Agents
• Institutional Real Estate Consultants
• Private Equity Real Estate Professionals
📊 Database Details
• 4,000 Verified Real Estate Funds (2022–2025)
• 9,700+ Key Contacts
• 7,700+ Verified Emails
• Global Coverage: North America, Europe, Middle East, Asia-Pacific
• Structured by: Fund Type, Strategy, and Regional Focus
• Format: Excel (.xlsx)
• Delivery: Manual dispatch within 24 hours of payment
• Payment Options: PayPal or Credit Card — No Refunds on Database Sales
View the Database Details on the Video Below
🌍 The Global Expansion of Real Estate Fund Formation: Mapping Institutional Capital Flows (2022–2025)
After reviewing my proprietary Real Estate Fund Investors Database, I’ve outlined several key observations on where institutional and private capital is currently being deployed across the global property and real assets sector.
Between 2022 and 2025, the real estate investment landscape has seen a strong rebound – with over 4,000 active funds verified in my database, representing both new launches and capital programs actively deploying into real estate, infrastructure, and income-generating property assets worldwide.
From sovereign and pension-backed vehicles to independent private equity real estate (PERE) platforms, institutional fund formation has accelerated across North America, Europe, the Middle East, and Asia-Pacific – signaling renewed global appetite for hard-asset exposure amid inflationary pressure and volatile public markets.

🏙 The Core-to-Value-Add Shift
Roughly 60% of the new funds launched between 2022 and 2025 target Core-Plus and Value-Add strategies, emphasizing repositioning, operational optimization, and rental growth potential.
This marks a gradual shift from passive Core holdings to more active capital deployment – a pattern most visible in the U.S., Europe, and Australia.
Examples include:
- Heitman Core-Plus Fund V (US/Europe) – pursuing income growth through operational improvements.
- Patrizia PERE IV (Germany) – value-add and logistics repositioning across EU gateways.
- Gulf Capital Real Estate Fund II (UAE) – hybrid Core-Plus / opportunistic strategies across GCC hospitality and multifamily.
These vehicles aim to capture risk-adjusted returns of 10–14% IRR, signaling a middle-ground preference between stable income and tactical appreciation.
🧩 The Rise of Thematic and Sector-Focused Vehicles
Post-2022, a growing number of real estate funds are narrowing their mandates – prioritizing single-sector exposure or specialized income strategies.
Leading examples include:
- Industrial & Logistics: EQT Exeter Fund IV, Clarion Partners Logistics Fund, and ESR Kendall Square RE Fund (Asia).
- Residential / Multifamily: GID Partners, CBRE IM Multifamily Fund VIII, and Abu Dhabi’s Aldar Living Platform.
- Healthcare & Senior Living: Harrison Street Real Estate Partners IX, AXA IM Healthcare Fund.
- Hospitality & Tourism: Ennismore Development Partners, Kingdom Hotel Investments II.
This sectoral specialization reflects investor demand for resilience and thematic clarity – with industrial and multifamily still dominating allocation pipelines.
🌏 Regional Trends in Fund Formation
North America continues to lead in fundraising volume, driven by U.S. and Canadian managers pursuing institutional mandates across logistics, multifamily, and debt strategies.
Europe remains active, particularly among mid-market value-add funds in the Nordics, DACH, and UK regions.
The Middle East is emerging as both a capital source and destination – with sovereign-linked and Shariah-compliant vehicles targeting hospitality, residential, and logistics assets.
Asia-Pacific demonstrates deep growth in mixed-use and industrial developments, especially across Japan, South Korea, and Australia.
Collectively, these regions now represent the most diversified real estate capital landscape since 2019.
💡 Institutionalization and Alternative Allocations
Roughly 25–30% of all funds verified between 2022–2025 are classified as Institutional Real Estate Funds backed by pension plans, insurers, and sovereign wealth vehicles.
Another 15% focus on Real Estate Debt – targeting senior and mezzanine loans to capitalize on high-rate environments and liquidity gaps among traditional lenders.
This reflects a more structured, institutionalized capital cycle where diversified yield and inflation-hedged returns are prioritized.
📈 Real Estate Fund Snapshot (2022–2025)
| Strategy Type | % of Funds | Example Funds | Typical Size (USD) |
| Core / Core-Plus | 35% | Heitman Core-Plus V, Patrizia PERE IV | $250M – $1.2B |
| Value-Add | 25% | GID Partners, CBRE IM Multifamily VIII | $300M – $1.5B |
| Opportunistic / Distressed | 15% | Bain Capital RE II, Oaktree Fund X | $500M – $2.0B |
| Sector-Focused (Logistics, Resi, Healthcare) | 15% | ESR Kendall Square, AXA Healthcare | $100M – $800M |
| Debt / Credit Strategies | 10% | Nuveen Real Estate Debt II, PIMCO CRE Credit Fund | $250M – $1.0B |
🏗 What This Means for Sponsors and Capital Advisors
For fund sponsors, developers, and placement agents, this surge in diversified real estate fund formation signals both renewed opportunity and greater competition.
Institutional LPs are emphasizing manager track record, sector clarity, and regional depth – creating a premium for fund managers who can demonstrate operational expertise and transparent governance.
Meanwhile, emerging managers in secondary markets are finding success through co-GP structures and programmatic JV alliances with institutional allocators – particularly in logistics, residential, and build-to-rent sectors.
💬 Closing Insight
From mid-market value-add funds in London and Dubai to billion-dollar logistics platforms in Texas and Tokyo, the global real estate fund ecosystem is accelerating into its next cycle – characterized by specialization, sustainability, and institutional capital alignment.
What we’re witnessing is not just a rebound – but a redefined real estate capital market where verified fund transparency and cross-border partnerships drive global growth.
📅 October 2025 – ✍️ Written by Andrew Thomas – The Investors Link
🔗 See my exclusive Real Estate Funds Database if you are raising capital or seeking institutional partnerships in property, infrastructure, or real assets.
Real Estate Fundraising – Investor Profiling Case Study

💼 Building a Global Investor Targeting Strategy: Inside a $100 Million Real Estate Fundraise
This is a custom Investor Database and Fundraising program I created for one of my USA based RE Clients.
In today’s competitive capital markets, data-driven investor targeting forms the cornerstone of successful fundraising execution. For a U.S.-based real estate fund seeking to raise $100 million, a bespoke global investor database was created to connect qualified capital sources with institutional-grade property opportunities. This initiative was not just about compiling contacts – it was about creating a strategic capital intelligence system that aligned each investor with the fund’s value proposition, risk profile, and market relevance.
🗂️ A Data-Centric Foundation for Investor Outreach
The database incorporates over 14,000 verified decision-makers across 20 major investor categories, covering institutional, private, and corporate segments. Each profile was mapped by region, investment style, and engagement priority to ensure that every contact received a relevant and timely message.
- 🇺🇸 U.S. Real Estate Funds (890 targets, 1,009 contacts)
Messaging: “Institutional U.S. Real Estate Performance Opportunity” - 🇨🇦 Canadian Real Estate Funds (27 targets, 51 contacts)
Messaging: “Cross-Border Access to U.S. Income Assets” - 🌍 Middle East & Asia Institutional Investors
Messaging: “Gateway to U.S. Institutional Real Estate” and “Diversified Property Income Allocation” - 🇬🇧 European and UK Allocators
Messaging: “Stable Yield and Inflation-Hedged U.S. Real Estate Income”
Each segment receives a custom one-to-one email approach, designed to establish credibility and promote early-stage investor dialogue.
🧭 Precision Targeting: Aligning Message with Capital Mandates
The investor database was structured to distinguish between mandatory allocators and opportunistic allocators, a critical factor in maximizing engagement efficiency.
- 🏦 Mandatory Allocators (Pension, Insurance, Endowment Funds)
These investors are obligated to maintain real estate exposure within their portfolios.
Strategy: Bulk institutional campaigns emphasizing “Reliable Yield and Stable U.S. Exposure.” - 👨👩👧👦 Opportunistic Allocators (Family Offices, UHNWIs, RIAs, Asset Managers)
These investors prioritize strategic opportunities with strong downside protection and consistent cash flow.
Strategy: Personalized, relationship-based outreach highlighting “Stable Property-Backed Returns.”
Special attention is given to the UAE UHNW segment, which includes approximately 9,000 private investors. They will be engaged through selective email blasts and staged follow-up cycles to assess immediate interest in U.S. income-producing real estate. (Note: Access to this database is reserved for clients pursuing capital raises of at least US $50 million and engaged under a minimum six-month retainer agreement.)
✉️ Integrated Messaging and Channel Optimization
Each investor group receives a tailored core message anchored in their asset allocation priorities:
- 📈 Institutional Investors: “Reliable Yield, Stable U.S. Exposure”
- 🏘️ Family Offices & UHNWIs: “Stable Property-Backed Returns”
- 🧱 Corporate & Investment Companies: “Strategic Diversification into Real Assets”
Outreach is executed via two main channels:
- Custom One-to-One Sequences: Used for high-value, relationship-driven investors such as family offices and RIAs.
- Bulk Institutional Outreach: Applied to larger allocator categories like pension funds and insurance firms, optimizing reach and cost efficiency.
This dual-stream approach ensured the program could balance scalability with the personalized touch required for high-level investor engagement.
📊 Projected Campaign Performance Metrics
| Metric | Typical Industry Range (Investor & Financial Outreach) | Projected Performance |
|---|---|---|
| Open Rate | 28% – 42% | ≈11,900 opens (35% average – higher for manual, lower for bulk) |
| Click-Through Rate (CTR) | 3% – 7% | ≈1,530 clicks (linked decks & DD documents) |
| Positive Responses / Meeting Interest | 1.5% – 3% | ≈750 qualified replies or meeting requests |
| Conversion to Active Dialogue | 0.5% – 1% | ≈275–300 investor conversations directed to client team |
Note: These are typical industry email marketing results and are for illustration purposes only.
These benchmarks mirror institutional-grade investor outreach results observed in private equity and alternative investment marketing campaigns, where manual targeting yields significantly stronger engagement than mass sends.
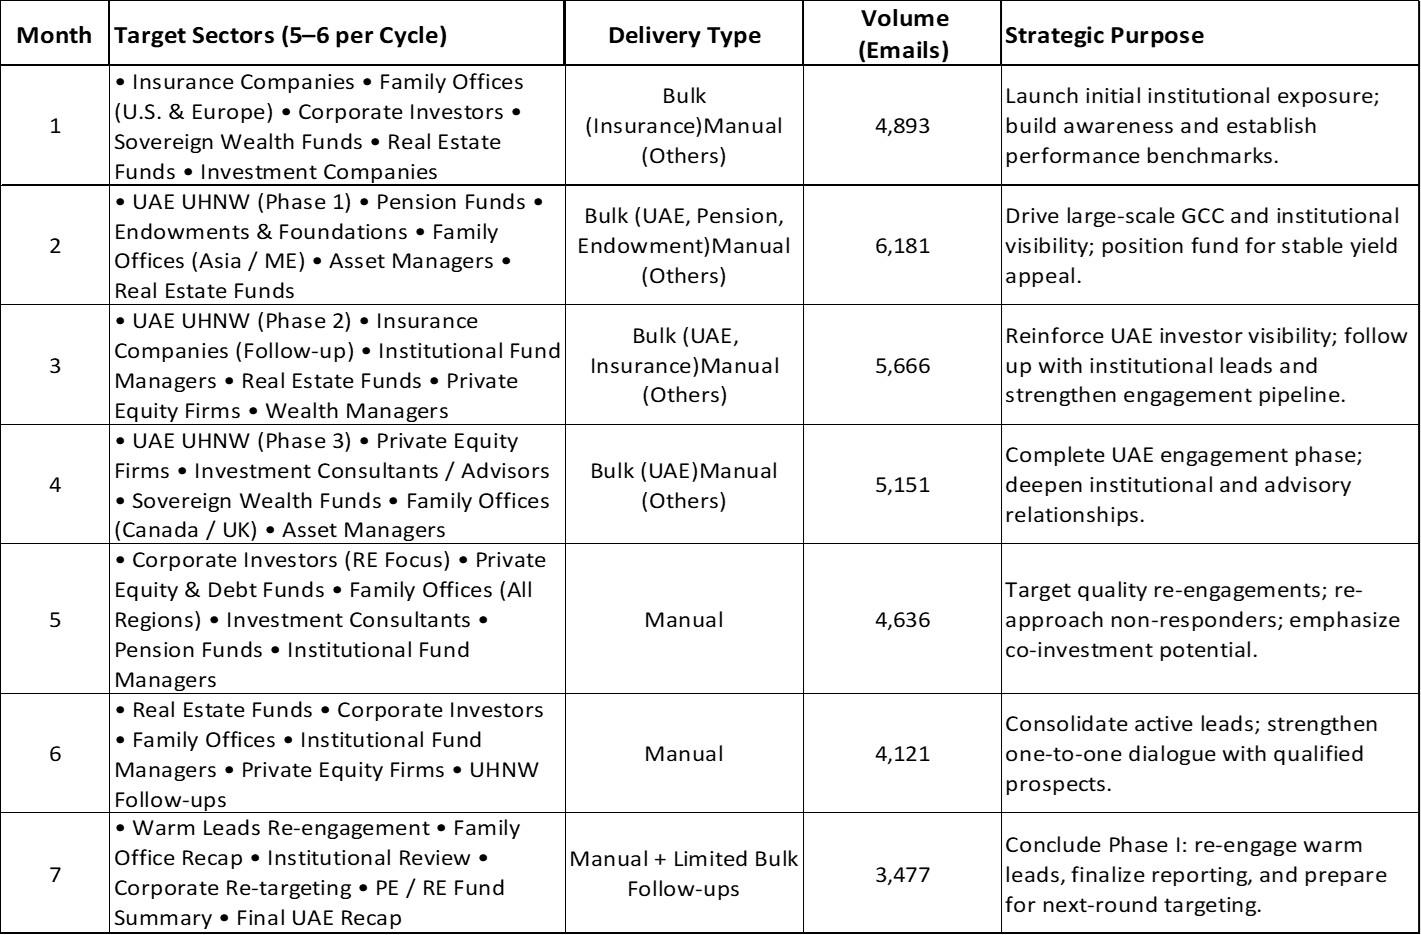
7-Month Investor Outreach Program Overview
Objective:
Execute a structured, seven-month global outreach campaign targeting over 34,000 institutional and private investors through a balanced mix of bulk and one-to-one communications. The program aims to optimize exposure, engagement, and qualified investor dialogue while refining targeting criteria monthly based on response analytics and deal alignment.
🌎 Conclusion: A Blueprint for Scalable, Data-Driven Fundraising
This project demonstrates how a structured, data-led investor intelligence model can transform traditional fundraising into a measurable, high-engagement process. By merging proprietary datasets, personalized messaging, and precise regional segmentation, the client now has a scalable roadmap to engage institutional allocators, family offices, and UHNW investors worldwide.
Each outreach sequence is designed not only to raise capital but to build long-term institutional partnerships and strengthen recognition among allocators seeking stable exposure to U.S. real estate assets. In short, this database serves as a fundraising infrastructure – one capable of connecting opportunity with capital, globally and intelligently.
Interested in the same program? Contact me for more information – Andrew Thomas – via the Contact Form on this website.

Great Places to Source Real Estate Capital in the United States in 2026 – Key Closed Funds to Watch!
A Data-Driven Outlook for Global Fund Managers
The closed real estate funds featured in this report are drawn exclusively from my Global Real Estate Funds Database and were selected based on verified allocation data and activity patterns updated through Q2 2025. Although we are now in late 2025, institutional real estate funds typically operate on deployment cycles that extend 18 to 36 months. These long term mandates allow us to identify managers that are positioned to remain active allocators well beyond 2026, given that closed funds typically deploy capital over multi year periods that can extend from three to seven years. This list is not a forecast but a data driven assessment grounded in sustained investment activity, consistent deal flow, and repeat commitments recorded across recent reporting cycles.
Closed real estate funds represent one of the most reliable sources of capital for sponsors seeking equity partnerships, development capital, structured solutions, and recapitalization support. Once a fund completes its raise, managers are obligated to deploy committed capital under well defined mandates, making these vehicles particularly relevant for developers, operators, and real estate companies entering 2026 with acquisition or development pipelines.
The United States continues to attract substantial institutional interest due to its liquidity, depth of product, and differentiated regional opportunities. With many funds now closed and entering their active allocation phase, the landscape offers tangible opportunities for real estate sponsors seeking credible capital partners. The following tables and profiles provide a detailed overview of this capital pool.
Closed Real Estate Funds Positioned for Deployment
The table below presents a representative sample of closed real estate funds that have completed their fundraising cycles and are positioned to deploy capital into the US market. These vehicles cover a range of strategies including value added, core, co investment, opportunistic, and sector specific mandates.
Table 1: Selected Closed Real Estate Funds in the United States
| Fund Name | Strategy | Status | Fund Size (USD M) | Primary Property Focus | Geography |
|---|---|---|---|---|---|
| Timberland Partners Apartment Fund IX | Value Added | Closed | 85 | Residential | United States |
| Beach Investment Fund II | Value Added | Closed | 84.5 | Residential | United States |
| HSRE OM Core Fund Co-Investment II | Core Co-Invest | Closed | 83.9 | Diversified | United States |
| Boston Financial California Fund II | Real Estate Debt | Closed | 83 | Residential and Senior Housing | United States |
| Clear Opportunities Fund I | Value Added | Closed | 83 | Diversified | United States |
| Harbour Equity JV Development Fund VI | Value Added | Closed | 82.5 | Residential | Canada with US direction |
| Arrowrock US Industrial Fund IV | Opportunistic | Closed | 82.3 | Industrial | United States |
| Leste 5 Pack Multifamily Fund | Value Added | Closed | 82 | Residential | United States |
| AREP Strategic Opportunity Fund IV | Value Added | Closed | 81.8 | Diversified | United States |
| Mastern US Private Real Estate Investment Trust 51 | Core | Closed | 81.66 | Residential | United States |
| Tioga Partners Fund III | Opportunistic | Closed | 80 | Diversified | Sun Belt United States |
| S3 SB Real Estate Capital Fund VI | Value Added | Closed | 78.6 | Diversified | United States |
| Gelfund Real Estate Opportunities 2 | Value Added | Closed | 76 | Residential | Northeastern United States |
| Marlin Spring Development Fund II | Value Added | Closed | 75.61 | Residential | Canada with US allocation potential |
| Blackstone Cognac Co-Investment Partners | Co-Invest | Closed | 75 | Diversified | United States |
| UBS Cold Storage Family Office Fund I | Opportunistic | Closed | 73.6 | Cold Storage, Logistics | United States |
| Third Lake RE SFR Fund II | Value Added | Closed | 73.4 | Single Family Rental | United States |
| Cinnaire Mid Atlantic Capital Fund 8 | Value Added | Closed | 73.3 | Residential | Mid Atlantic United States |
| DWF VI CF One Co-Invest | Co-Invest | Closed | 71 | Diversified | United States |
| Pixiu Woodbine Driskill | Core Plus | Closed | 70 | Hospitality | United States |
Strategic Deployment Themes Among Closed Funds
Closed funds give meaningful insight into where capital is moving. By reviewing commitments, strategy classifications, and sector themes, several clear patterns emerge for 2026 deployment.
Table 2: Strategy Distribution Across Closed Funds
| Strategy Category | Number of Funds in Dataset | Illustrative Examples |
|---|---|---|
| Value Added | High concentration | Timberland Partners Apartment Fund IX, Clear Opportunities Fund I, Leste 5 Pack Multifamily Fund |
| Opportunistic | Strong representation | Arrowrock US Industrial Fund IV, Tioga Partners Fund III, UBS Cold Storage Family Office Fund I |
| Core and Core Plus | Moderate share | Mastern US REIT 51, HSRE OM Core Co Investment II, Pixiu Woodbine Driskill |
| Co Investment Structures | Increasing prominence | Blackstone Cognac Co Investment Partners, DWF VI CF One Co Invest |
| Sector Specific and Thematic Funds | Growing segment | Boston Financial California Fund II, Third Lake RE SFR Fund II |
Key Observations
• The value added category remains dominant due to attractive pricing adjustments in multifamily, select office repositioning, and regional development opportunities.
• Opportunistic capital is targeting industrial development, cold storage, complex recapitalizations, and distressed situations.
• Co investment structures are becoming more popular as LPs seek alignment and deal level transparency.
• Specialist mandates such as single family rental, senior housing, and cold storage continue to appear in closed fund activity, reflecting structural demand drivers.
Sector Focus and Allocation Depth
Property type analysis shows a strong emphasis on residential themes combined with meaningful industrial and diversified exposure.
Table 3: Property Type Focus Among Closed Funds
| Primary Property Type | Representative Funds | Notes |
|---|---|---|
| Residential | Timberland Partners Apartment Fund IX, Beach Investment Fund II, Marlin Spring Development Fund II | Multifamily, senior living, and transit oriented developments show sustained appeal |
| Industrial and Logistics | Arrowrock US Industrial Fund IV, UBS Cold Storage Family Office Fund I | Supported by supply chain diversification and temperature controlled storage demand |
| Diversified Mandates | AREP Strategic Opportunity Fund IV, S3 SB Real Estate Capital Fund VI | Designed to capture repricing across multiple sectors |
| Hospitality | Pixiu Woodbine Driskill | Focused on restoration, repositioning, and heritage asset value |
| Single Family Rental | Third Lake RE SFR Fund II | Increasing institutionalization of SFR ownership |
| Affordable and Senior Living | Boston Financial California Fund II | Driven by federal and state incentives and demographic pressure |
Why Closed Funds Matter for Real Estate Sponsors in 2026
Closed funds represent a critical channel for capital raising because their investment timelines are committed, structured, and time bound. For real estate developers, operators, and GPs, this means:
• Capital is already raised and ready for deployment
• Managers are under formal mandates to execute transactions
• Strategies are clear, allowing for tailored deal sourcing
• Many closed funds seek co investment partners, JV structures, and programmatic relationships
• A diverse range of themes opens opportunities across residential, logistics, hospitality, and mixed use
In a market marked by repricing, interest rate adjustments, and regional divergence, sponsors that position themselves in front of active closed fund allocators will have a material advantage as 2026 unfolds.
Disclaimer
The information provided in this report is sourced from institutional grade databases and relies on third party information. Accuracy is based on the latest available reporting, but future investment activity cannot be guaranteed.
December 2025 – ✍️ Written by Andrew Thomas – The Investors Link
🔗 Explore my exclusive Real Estate Fund Database, a premium resource designed for fund managers and corporate leaders seeking access to global state capital, strategic co investment partners, and long horizon institutional allocators.

🌍 Global Hospitality and Hotels Real Estate Funds Positioned to Deploy Capital Through 2026
📊 A Data-Driven Sector Outlook from the Global Real Estate Funds Database
This report presents a curated analysis of 94 institutional hospitality and hotel-focused real estate funds drawn from my proprietary Global Real Estate Funds Database. These vehicles span North America, Europe, Asia-Pacific, the Middle East, and diversified global mandates, representing the most active capital allocators within the global hospitality sector.
The funds included were selected based on verified strategy classification, fund lifecycle status, fundraising activity, and observed deployment behavior, with data coverage updated through Q1 2025. Hospitality real estate funds typically operate on multi-year investment and repositioning cycles of 24 to 48 months, providing forward visibility into which vehicles maintain active acquisition mandates and uncalled capital extending into 2026.
This is not a projection of guaranteed capital commitments. It is a research-driven outlook based on capital formation trends, historical deployment velocity, repeat sponsor behavior, platform expansion, and sector-specific structural tailwinds.
🏨 Global Hospitality Real Estate Market Context
The hospitality and hotel sector has re-emerged as one of the most actively allocated real estate asset classes globally. Institutional investors increasingly view hospitality as an operational real asset capable of capturing revenue growth, inflation-linked pricing, and value creation through repositioning.
Key global drivers include:
🏖️ Recovery of international leisure and business travel
📈 Growth in experiential, lifestyle, and destination tourism
🏙️ Urban revitalization and rebranding opportunities
💼 Institutionalization of hotel operating platforms
🔄 Distressed and below-replacement-cost entry points in select markets
Hospitality has evolved from a cyclical allocation into a durable thematic strategy across global real estate portfolios.
📈 Market Research Overview: Hospitality Fund Activity Entering 2026
💰 Fund Size and Capital Deployment Characteristics
Table 1: Hospitality Fund Capital Profile (2022 to Q1 2025)
| Metric | Observed Range |
|---|---|
| Median fund size | USD 150m to 600m |
| Upper-tier platforms | USD 750m to 1.5bn |
| Core deployment rate | 8% to 15% annually |
| Value-added deployment rate | 15% to 25% annually |
| Opportunistic deployment rate | 20% to 30% annually |
| Core target net IRR | 7% to 9% |
| Value-added target net IRR | 11% to 15% |
| Opportunistic target net IRR | 16% to 22% |
Hospitality funds typically deploy capital faster than office or retail vehicles due to shorter acquisition timelines, smaller deal sizes, and platform-based sourcing strategies.
🧭 Dominant Strategic Themes Across Hospitality Funds
🏝️ Leisure and Destination Hospitality
Resort, wellness, and leisure-driven assets located in coastal, alpine, island, and tourism-centric destinations.
🏨 Urban Select-Service and Boutique Hotels
Value-added strategies targeting under-managed or under-branded urban assets in gateway and secondary cities.
🔧 Distressed and Post-Cycle Recovery Strategies
Opportunistic funds acquiring assets impacted by capital structure stress or operational disruption.
💳 Hospitality Credit and Structured Finance
Debt-focused strategies providing senior loans, mezzanine capital, and construction financing.
🌱 ESG, Wellness, and Experiential Hospitality
Sustainability-led redevelopment, wellness resorts, and environmentally aligned hospitality platforms.
🌐 Geographic Capital Deployment Patterns
Table 2: Regional Allocation Focus by Hospitality Funds
| Region | Capital Characteristics |
|---|---|
| North America | Select-service, branded urban hotels, repositioning strategies |
| Europe | Southern Europe, France, Germany, UK, pan-European tourism |
| Asia-Pacific | Japan-focused value plays, Australia leisure assets |
| Middle East | Tourism-driven development and lifestyle hospitality |
| Multi-Regional | Diversification across OECD hospitality markets |
🗂️ Hospitality Funds Positioned to Deploy Capital Through 2026
Funds were grouped by strategy type, deployment behavior, and mandate structure.
🏢 Group 1: Large-Scale Global and Regional Hospitality Platforms
Institutional sponsors with multi-fund hospitality programs and repeat capital cycles.
Representative Funds:
• MCR Hospitality Fund IV
• Rockbridge Hospitality Fund IX
• Pro-invest Asia-Pacific Hospitality Opportunity Fund III
• North Wind Banor Pan-European Hospitality Fund
• Japan Hospitality Fund I and II
• Lifestyle Hospitality Fund (Saudi Arabia)
📌 Commentary:
These platforms benefit from scale, operating depth, and long-term sponsor relationships, resulting in sustained acquisition activity regardless of market conditions.
🔄 Group 2: Value-Added and Repositioning Hospitality Funds
Funds focused on operational improvement, asset repositioning, and rebranding.
Representative Funds:
• Hospitality Transformation Fund 1
• HPI Real Estate Fund Series
• Mindston Hotels Signature
• LHG Hotel Fund II
• FREO Spanish Hotel Fund
📌 Commentary:
These vehicles are particularly active in fragmented ownership markets where operational inefficiencies create pricing dislocation.
⚠️ Group 3: Opportunistic, Distressed, and Special Situations Funds
Funds targeting distressed assets, opportunity zones, and complex capital stacks.
Representative Funds:
• Integris DLV Opportunity Zone Fund
• Linchris Capital Opportunity Fund III
• Lightstone QOF I
• Shopoff DLV QOZ Fund
• OREI Credit Fund III
📌 Commentary:
Capital deployment in this group accelerates during periods of market stress and refinancing pressure.
🧩 Group 4: Boutique, Single-Asset, and Niche Hospitality Vehicles
Smaller funds focused on specific assets, cities, or sub-sectors.
Representative Funds:
• PG single-deal hotel vehicles
• Pixiu Woodbine Driskill
• Crescent GPIF hotel partnerships
• Regional European and Australian hospitality funds
📌 Commentary:
While smaller in scale, these funds often deploy capital quickly and operate with shorter hold periods.
🌿 Group 5: ESG, Wellness, and Experiential Hospitality Funds
Thematic strategies aligned with sustainability and lifestyle trends.
Representative Funds:
• Safeguard Global Wellness Retreat Fund
• L’Organic Australia Wellness Resort Fund
• Hellenic Serviced Apartment Regeneration Fund
📌 Commentary:
Institutional demand for ESG-aligned hospitality exposure continues to expand, supporting long-term capital formation.
🔮 Conclusion: Hospitality Capital Deployment Outlook Through 2026
Hospitality and hotel real estate funds are positioned for sustained deployment through 2026, supported by structural tourism growth, operational upside, and improving global travel patterns. Compared to other property sectors, hospitality offers a compelling balance of income recovery and value creation.
🗃️ Positioning Within the Global Real Estate Funds Database
This hospitality and hotels report represents a sector-specific extract from the broader Global Real Estate Funds Database, which tracks institutional real estate vehicles across all major asset classes and geographies.
The database enables precise investor targeting through standardized fields including strategy type, fund status, geographic focus, capital size, and deployment behavior.
⚖️ Disclaimer
This report is based on third-party data, verified fund disclosures, and manager activity through Q1 2025. Fund strategies, capital availability, and timelines remain subject to change.
December 2025 – ✍️ Written by Andrew Thomas – The Investors Link
🔗 Explore the Global Real Estate Funds Database, the institutional-grade resource for identifying active hospitality, hotel, and real estate capital allocators worldwide.

RARE REAL ESTATE INVESTORS DATABASE – FUNDRAISING CAMPAIGN VERSION!
Database Release · April 2026
Stop Spending Weeks Building Investor Lists. This Database Does It in Hours.
If your team is targeting institutional capital for a $250M+ raise, the hardest part is rarely the pitch – it’s finding the right rooms to walk into. This database was built to solve exactly that.
The Problem Every Fundraising Team Knows
You have a compelling fund structure, a strong track record, and a clear thesis. What you don’t have is six weeks to spare building a target investor list from scratch. Yet that’s exactly what most teams end up doing – combing through databases, cross-referencing filings, hunting down verified contacts, and manually building the kind of list that should have been ready before the campaign even started.
The reality of institutional fundraising is brutal on time. Verified investor data – the kind that tells you who is actively allocating to real estate, in what size, and who inside that institution you actually need to speak to – takes serious effort to compile. Most teams either invest that time and delay their launch, or they shortcut it and spend the first months of their raise cleaning bad data.
This database was built as the answer to that problem.
What Makes This Dataset Different
There is no shortage of generic contact lists on the market. What is genuinely rare is a dataset built specifically around verified, active real estate allocators – institutions that have confirmed mandates, fund commitments, or documented property exposure. Every profile has been drawn from institutional filings, verified fund disclosures, and tracked allocation programs. This is investment-grade intelligence, not scraped web data.
The 2026 edition covers 13,600 global institutions with 16,400 key contacts, all with personal company email addresses, cleaned and updated as of April 2026. When your team opens this file, you are working with current data – not last year’s fund manager who has since moved on.
Who Is Inside This Database
The dataset spans the full spectrum of institutional real estate capital:
- Sovereign Wealth Funds
- Pension Funds (Public & Private)
- Insurance Companies
- Investment & Asset Management Firms
- Family Investment Offices
- Banks & Investment Companies
- Endowments & Foundations
- Superannuation Schemes
- Fund-of-Funds & Real Estate Fund Managers
- Infrastructure & Real Assets Investors
Geographic coverage spans North America, Europe, the Middle East, and Asia-Pacific – structured by institution type, investment focus, and real estate allocation profile. Whether your raise targets a specific region or requires global distribution, this dataset has the depth to support it.
The Time Advantage Is Real
To put this in practical terms: building a comparable list internally — verifying allocations, tracking down contacts, confirming emails — is a task that typically takes a dedicated analyst or a small team several weeks. That is weeks before your first outreach call goes out, weeks of delay in a market where timing and momentum matter enormously in a raise.
With this database, a campaign-ready investor list is available within 24 hours of purchase. Your team can be in market – not still preparing for it.
For groups targeting raises of $250 million and above, the leverage here is significant. Institutional investors at this level expect sophisticated outreach. They expect that you have done your homework on who they are, what they invest in, and why you are approaching them. Having clean, structured, verified data is the foundation of that credibility.
Campaign-Ready From Day One
The file arrives in Excel format, structured so it can be loaded directly into a CRM, imported into an email campaign platform, or used by a placement team to begin segmenting and prioritising outreach immediately. No reformatting. No cleaning. No hunting for missing fields.
This is not a research starting point — it is a campaign launch pad.
For placement agents and investment advisors managing multiple mandates, the value compounds. A single database purchase supports multiple campaigns across different strategies, geographies, and investor segments. The cost-per-contact — against the alternative of building and verifying each record independently – is effectively negligible.
Ideal for:
- Fund Managers & Real Estate Developers
- Investment Advisors & Placement Agents
- Institutional Capital Partners
- Private Equity Real Estate Professionals
A Note on Quality
What separates this dataset from what you can piece together on your own is not just scale- it is the curation. Generic investor directories exist. Lists scraped from websites exist. What is genuinely hard to replicate is a dataset filtered specifically to active real estate allocators, verified at the institutional level, with named contacts and working direct emails. That combination is what makes this list rare and immediately deployable.
If your team is preparing for a significant raise and needs to reach institutional decision-makers efficiently and credibly – this is where that process begins.
📊 Database Details
- 13,600 Verified Institutional Investor Firms
- 16,400 Key Contacts – all with personal company emails – updated and cleaned in April 2026
- Global Coverage: North America, Europe, Middle East, Asia-Pacific
- Structured by: Institution Type, Investment Focus, and Real Estate Allocation
- Format: Excel (.xlsx)
- Delivery: Manual dispatch within 24 hours of payment
- Payment Options: PayPal or Credit Card – No Refunds on Database sales
April 2026 – ✍️ Written by Andrew Thomas – The Investors Link
May 2026 – ✍️ Written by Andrew Thomas – The Investors Link
The 13,680 Institutional Real Estate Investors: Who They Are and What They Want in 2026
🌍 The Institutional Real Estate Investor Universe
The global institutional real estate market is estimated at US$10.2 trillion in professionally managed assets, according to LaSalle Investment Management’s Real Estate Universe Estimates.
The Americas account for the largest single regional share at 35% (US$3.7 trillion), followed by Asia-Pacific at 32% (US$3.3 trillion) and Europe at 28% (US$2.8 trillion).
Within this market, fewer than 2,000 of the United States’ approximately 65,000 pension plans actually invest in real estate.
The institutional real estate investor universe is, by design, a concentrated community of large, sophisticated capital allocators.
📊 Key Market Statistics
| Metric | Value | Context |
|---|---|---|
| Global institutional real estate universe | US$10.2T | LaSalle Investment Management |
| Global pension fund assets | US$68.3T | Global Pension Assets Study 2026 |
| Average RE allocation (2025) | 10.7% | Hodes Weill / Cornell |
| Institutions surveyed | 166 | Across 26 countries |
| Active US pension investors in RE | ~2,000 | Out of ~65,000 total |
| Institutional RE assets tracked | US$1.4T | Largest global tracking dataset |
💬 Market Insight
“While we’re seeing the first decline in target allocations since our survey began, this is consistent with the expected tactical pause we reported last year rather than a strategic shift away from real estate.”
— Douglas Weill, Managing Partner, Hodes Weill & Associates, October 2025
🏦 Pension Funds: Scale, Process, and the Consultant Layer
Pension funds are the single largest institutional investor category globally, with US$68.3 trillion in assets.
Real estate plays a structurally important role, typically around 9% allocation, with increasing emphasis on income-generating assets due to demographic outflows.
📋 Pension Fund Characteristics
| Dimension | Characteristics and Implications |
|---|---|
| AUM scale | US$1B to US$500B+ |
| RE allocation | ~9% average |
| Decision structure | Board + consultants (NEPC, Mercer, Aon) |
| Manager selection | Formal RFP, 5–7 year track record |
| Timeline | 12–24 months |
| Preferred strategies | Core / core-plus |
| Fee sensitivity | High |
| ESG | Mandatory |
🌐 Sovereign Wealth Funds: Long Horizon, Co-Investment Appetite, and ESG Filters
Sovereign wealth funds operate with perpetual investment horizons, making them ideal long-duration capital providers.
📋 SWF Characteristics
| Dimension | Characteristics and Implications |
|---|---|
| AUM scale | US$100B to US$1.77T |
| Investment horizon | Perpetual |
| RE allocation | 5–15% |
| Strategy | Direct + co-investment |
| Access | Relationship-driven |
| ESG | Santiago Principles, TCFD |
| Preferred sectors | Data centres, logistics, infrastructure |
🏠 Institutional-Grade Family Offices: Speed, Flexibility, and Sector Concentration
Family offices with US$500M+ AUM increasingly behave like institutional investors but maintain speed and flexibility advantages.
📋 Family Office Characteristics
| Dimension | Characteristics and Implications |
|---|---|
| AUM range | US$500M to US$20B+ |
| RE allocation | 15–25% |
| Decision speed | 60–120 days |
| Strategies | Logistics, data centres, credit |
| Due diligence | 2–6 months |
| Access | Referrals + targeted outreach |
🎓 Endowments and Foundations: Risk Appetite and the Endowment Model
Endowments pioneered the “Endowment Model”, emphasizing illiquid alternatives for long-term outperformance.
📋 Endowment Characteristics
| Dimension | Characteristics and Implications |
|---|---|
| AUM scale | US$500M to US$53B |
| RE allocation | 8–15% |
| Return targets | 9–15%+ IRR depending on strategy |
| Philosophy | Long-term, top-quartile focus |
| ESG | Strong and growing |
| Reporting | Extremely high standards |
🛡️ Insurance Companies: Liability-Driven Investment and Income Focus
Insurance companies are shaped by liability matching and regulatory constraints, making them income-focused investors.
📋 Insurance Company Characteristics
| Dimension | Characteristics and Implications |
|---|---|
| AUM scale | US$1T+ |
| RE allocation | 3–8% |
| Strategy | Core, income-focused |
| Yield targets | 4–6% |
| Constraints | Solvency II / RBC |
| Timeline | 9–18 months |
🏢 REITs: Public Market Efficiency and Sector Specialisation
REITs act as both investors and capital vehicles, bridging public and private real estate markets.
📋 REIT Characteristics
| Dimension | Characteristics and Implications |
|---|---|
| Role | Buyer + LP + JV partner |
| Strategy | Sector-specialised |
| Allocation model | Public + private blend |
| Access | Acquisition teams + CIOs |
| Focus | Operational expertise |
🔍 What Institutional Real Estate Investors Have in Common
Across all investor types, a consistent set of due diligence requirements defines capital allocation decisions.
📊 Core Institutional Requirements
| Requirement | Why It Matters | How It Is Evaluated |
|---|---|---|
| Track record | Proof of performance | 5–7 years audited |
| Fund structure | Governance requirement | Admin, audit, LPA |
| Reporting | Oversight obligation | NAV, ESG, GRESB |
| GP alignment | Incentive alignment | 1–5% co-invest |
| Team depth | Key-person risk mitigation | Succession planning |
| ESG | Regulatory + fiduciary | TCFD, GRESB |
| Fees | Governance scrutiny | Market benchmarks |
🧠 Strategic Takeaway
The fund manager who approaches the institutional real estate capital raise as a documentation and process discipline – rather than a sales exercise — is the one who converts.
Institutional investors are persuaded by:
- Evidence
- Structure
- References
- Governance discipline
💬 Final Insight
The institutional real estate investor universe is large, but the community of managers that successfully raises capital from it repeatedly is small.
The distinction is not strategy or timing — it is infrastructure quality: governance, reporting, alignment, and relationships.
📚 Sources
- LaSalle Investment Management Real Estate Universe Estimates
- Hodes Weill & Associates / Cornell University Institutional Real Estate Allocations Monitor 2025
- IREI Institutional Real Estate FAQ
- Global Pension Assets Study 2026 (EQT / Willis Towers Watson)
- CFA Institute Portfolio Management for Institutional Investors 2026
- Cohen & Steers Real Estate Allocations Monitor
- Nareit 2026 Outlook
- Bruegel Policy Brief (April 2026)
The New Reality of Family Office Capital in Real Estate
Key Note to Readers: All the information in this report was created using my exclusive and updated database of USA Family Investment Offices. Purchase details and YouTube Video are at the bottom of the article.
May 2026 – ✍️ Written by Andrew Thomas – The Investors Link
Family offices have evolved into one of the most important and flexible capital sources in global real estate. Unlike traditional institutions, they operate without rigid allocation mandates, enabling them to:
- Allocate across the full risk spectrum
- Invest in both funds and direct deals
- Move faster on high-conviction opportunities
In 2026, this flexibility is not just an advantage. It is a decisive edge.
This report identifies the Top 50 U.S. and North American family offices most likely to commit to real estate funds, based on a proprietary analysis of 200+ firms.
How This Ranking Was Built
This is not a simple AUM ranking.
Each firm was evaluated across five institutional criteria:
| 🔍 Factor | Description |
|---|---|
| 🏢 Private Real Estate Exposure | Active allocation to private real estate strategies |
| 🤝 Co-Invest Appetite | Willingness to deploy alongside fund managers |
| 🌍 Geographic Flexibility | Ability to invest beyond domestic markets |
| 📊 Strategy Alignment | Focus on value-add, opportunistic, and credit |
| 🚀 First-Time Fund Openness | Willingness to back emerging managers |
Key Market Insight
The most valuable family office capital is not the largest. It is the most flexible.
Across the dataset:
- ~90% invest in real estate
- ~70% invest in private real estate
- ~50% actively co-invest
- ~20–25% consider first-time funds
This creates a deep, actionable capital pool for fund managers.
🏆 Tier 1: High-Conviction Investors (Top 20)
These firms represent the highest probability capital sources for real estate funds in 2026.
They combine:
- Scale
- Flexibility
- Proven appetite for funds and co-investment
Top 20 Investors
| Rank | Firm | Key Characteristics |
|---|---|---|
| 1 | Belzberg & Co. | Multi-strategy, highly flexible, co-invest heavy |
| 2 | Biltmore Family Office | Global allocator, first-time fund friendly |
| 3 | BigSur Partners | Opportunistic + credit focus |
| 4 | Brightside Partners | Global reach, emerging manager exposure |
| 5 | Andina Family Offices | Debt-oriented, co-invest active |
| 6 | Okabena Advisors | Institutional-grade allocator |
| 7 | LGL Partners | Core-plus, value-add, co-invest |
| 8 | Fifth Avenue Family Office | Balanced fund + direct investor |
| 9 | Tailwind Advisors | Debt and value-add specialist |
| 10 | Provenio Capital | Credit-focused allocator |
| 11 | RWN Management | Opportunistic, flexible |
| 12 | Certis Capital Management | Multi-strategy exposure |
| 13 | Huizenga Capital Management | Opportunistic + emerging manager interest |
| 14 | Hallador Investment Advisors | Broad strategy flexibility |
| 15 | BLD Holdings | Full-cycle investor |
| 16 | Dancap Family Investment Office | Institutional discipline + flexibility |
| 17 | GreenBear Group | Strong emerging manager track record |
| 18 | Ocean Road Advisors | Co-invest and JV oriented |
| 19 | Pittco Management | Global allocator |
| 20 | Summer Hill Capital Partners | Value-add + co-invest |
Why These Investors Matter
These firms are not passive LPs.
They typically:
- Commit to funds
- Upsize allocations via co-investment
- Maintain long-term manager relationships
📊 Tier 2: Institutional-Style Allocators (Ranks 21–35)
These are reliable fund investors, often with more structured processes.
Key Characteristics:
- Larger platforms
- Investment committees
- Strong due diligence frameworks
Investors
| Rank | Firm | Profile |
|---|---|---|
| 21 | East Rock Capital | Institutional allocator |
| 22 | Boston Family Office | Diversified exposure |
| 23 | Beaumont Financial Partners | Large MFO platform |
| 24 | Stelac Advisory Services | Institutional RE allocator |
| 25 | Tectonic Advisors | Structured investment process |
| 26 | LVW Flynn | Opportunistic tilt |
| 27 | Cherry Creek Family Office | Core-plus/value-add |
| 28 | Pennington Partners & Co | Global + co-invest |
| 29 | Sawmill Private Management | Flexible capital |
| 30 | CSM Capital Corporation | Hybrid investor |
| 31 | Colter Lewis Investment Partners | Direct + fund mix |
| 32 | Covenant Multifamily Offices | Value-add focus |
| 33 | William Harris Investors | Multi-strategy |
| 34 | Andina Family Offices | Repeat allocator |
| 35 | BigSur Partners | Scalable platform |
Strategic Takeaway
These investors are ideal for:
- Anchor commitments
- Larger tickets
- Institutional validation
However:
- Timelines are longer
- Processes are more structured
🚀 Tier 3: Emerging & Flexible Capital (Ranks 36–50)
This segment is often overlooked but highly valuable.
Why They Matter
These firms:
- Are more relationship-driven
- Move faster
- Are more open to differentiated strategies
Investors
| Rank | Firm | Profile |
|---|---|---|
| 36 | AWM Capital | Entrepreneurial client base |
| 37 | Tallwoods Partners | Flexible allocator |
| 38 | Park Miller | Relationship-driven |
| 39 | Blossom Wealth Management | Active but selective |
| 40 | SP Family Office | Strategy-aware |
| 41 | Roanoke Capital Management | Global + co-invest |
| 42 | Schwartz Capital Group | Value-add focused |
| 43 | Perspecta Trust | Institutional backing |
| 44 | Cook Pine Capital | Credit-focused |
| 45 | Hallador Investment Advisors | Repeat potential |
| 46 | Keyser Capital | Selective allocator |
| 47 | Orison Capital | Flexible capital |
| 48 | Roadstead Capital Partners | Conservative allocator |
| 49 | Family Office Research | Broad exposure |
| 50 | Acorn Creek Capital | Emerging allocator |
📌 What Fund Managers Must Understand
1) Co-Investment Is the Key Lever
Over 70% of top-ranked firms:
- Expect co-investment opportunities
- Use co-invest to increase exposure
Funds without co-invest capability are structurally disadvantaged.
2) Mid-Sized Family Offices Are the Sweet Spot
The most active segment:
- $500M – $3B AUM
They offer:
- Faster decision-making
- Greater flexibility
- Meaningful ticket sizes
3) Strategy Positioning Matters
Most in-demand strategies:
| Strategy | Demand |
|---|---|
| Value-Add | Very High |
| Opportunistic | Very High |
| Debt / Credit | High |
| Core-Plus | Moderate |
4) Hybrid Investors Dominate
The best targets are not:
- Pure LPs
- Nor purely direct investors
They are:
Hybrid investors allocating across funds, co-investments, and direct deals.
🧭 How to Approach These Investors
Step 1: Target Tier 1 First
- Focus on Top 20
- Offer co-invest visibility
- Lead with differentiated strategy
Step 2: Build Institutional Credibility (Tier 2)
- Formal pitch materials
- Strong track record narrative
- Risk-adjusted returns
Step 3: Develop Relationships (Tier 3)
- Smaller tickets
- Early commitments
- Long-term engagement
Final Thought
Family offices are no longer “alternative” capital.
They are now:
Core drivers of real estate investment activity, particularly in value-add, opportunistic, and credit strategies.
For fund managers in 2026:
- The opportunity is significant
- The capital is available
- The differentiation lies in access, structure, and positioning
📊 Database Details
- 13,600 Verified Institutional Investor Firms
- 16,400 Key Contacts – all with personal company emails – updated and cleaned in April 2026
- Global Coverage: North America, Europe, Middle East, Asia-Pacific
- Structured by: Institution Type, Investment Focus, and Real Estate Allocation
- Format: Excel (.xlsx)
- Delivery: Manual dispatch within 24 hours of payment
- Payment Options: PayPal or Credit Card – No Refunds on Database sales
May 2026 – ✍️ Written by Andrew Thomas – The Investors Link
