

November 2026
For anyone raising capital, the hardest question is never “is there money out there.” There is always money out there. The hard question is whose money, earmarked for what, and how soon they need to put it to work. A fund that just held a final close isn’t a headline — it’s a deadline. Limited partners did not commit nine- and ten-figure checks to watch a general partner sit on cash; investment periods run three to six years, and the clock on that capital started the day the fund closed.
We went through a database of more than 24,800 institutional funds — private equity, venture capital, real estate, infrastructure, private debt and natural resources vehicles, with fund-close reporting running from 2022 through late 2024 — and isolated every fund that hit a final close since the start of 2024. The result is a map of roughly $800 billion in institutional capital that closed across nearly 2,000 vehicles in that window. Layer in the funds that were still raising at the time but had already banked a first or second close, and the pool grows past $1.1 trillion.
This piece walks through where that capital sits — by asset class, by sector, by strategy, and by geography — and, just as importantly, where it stands today in its own lifecycle. A fund that closed in early 2024 isn’t a fresh headline anymore — it’s roughly three years into a three-to-five-year investment period, which means the real question isn’t “who raised money recently,” it’s “who is still obligated to deploy, how much runway do they have left, and which of these funds are now in their final stretch.” That’s a different exercise from the fundraising-environment commentary that dominates most capital markets coverage, which tends to focus on whether raising money is “hard” or “easy” in the abstract. The useful question for anyone building a target list is narrower: given everything that did close in the last fully-reported cycle, who still has money sitting in an active investment period right now, and what are they contractually required to do with it before that window closes?
The headline numbers
Start with the cleanest cut: funds that recorded a final close with a close date of January 2024 or later. That’s 1,925 vehicles totaling $804.7 billion. These are not funds “in market” or “targeting” a raise — they are funds that finished raising, turned the taps off to new LPs, and are now inside their investment period, obligated by their own fund documents to deploy.
Sitting alongside that cohort is a second, less obvious pool: 1,759 funds that were still actively raising at the time of reporting — still open to new commitments — but had already passed a first, second or third close since January 2024, banking $340 billion in the process. These GPs hadn’t finished fundraising, but they weren’t waiting for a final close to start investing; capital from an interim close is capital a fund can and typically does start deploying immediately, both to prove a track record to the LPs still being courted and because return clocks don’t pause for fundraising logistics.
A note on data vintage before going further, because it matters for everything below: fund-close reporting in this dataset effectively stops in late September 2024 — the underlying extract was compiled around that point, so Q4 2024 and all of 2025 are essentially unreported here, not evidence of a slowdown. That means every fund discussed in this piece is now, as of today, somewhere between two and three years into its investment period rather than freshly closed — which is precisely why the framing of this piece is “where does this capital stand today,” not “what just happened.” For the three-to-five-year investment periods standard in this market, a fund that closed in the first half of 2024 is now well past its halfway point, and for the shortest-duration strategies covered below, several are already approaching the end of their deployment window entirely.
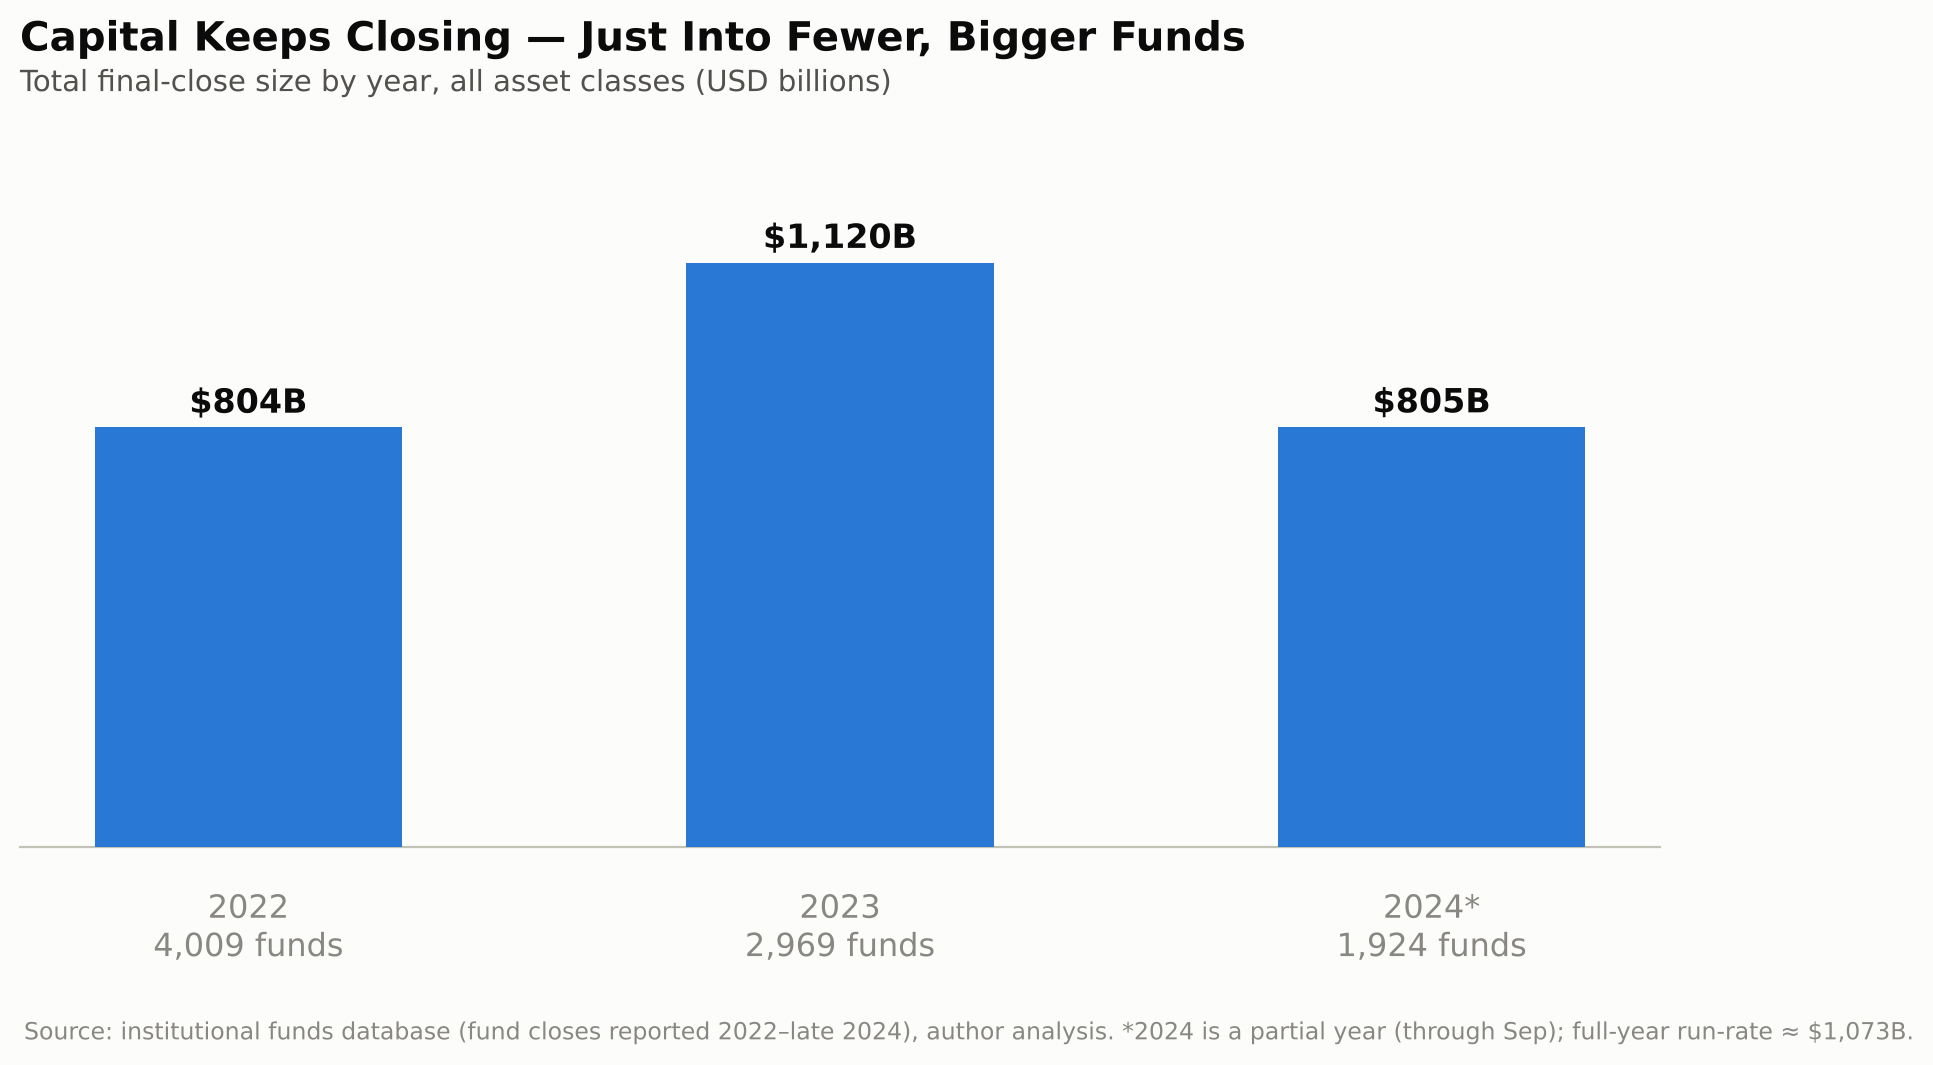
Put those two cohorts side by side and a pattern falls out that matters more than the headline figure: the number of funds closing shrank every year from 2022 to 2024, while the average size of the fund that did close more than doubled. In 2022, 4,009 funds closed at an average size of $201 million. In 2023, that fell to 2,969 funds — but the average size jumped to $377 million. Through the first nine reported months of 2024, 1,924 funds had closed at an average size of $418 million.
That 2024 figure needs one honest caveat: because reporting stops in late September, 2024 is a nine-month year, not a twelve-month one. Scaled to a full-year run rate, 2024 implies roughly 2,565 funds and $1,073 billion for the full year — which would put full-year 2024 fund count modestly below 2023, but dollar volume essentially flat to slightly ahead of 2023’s $1.12 trillion. The fewer-but-bigger-funds trend is unambiguous and fully confirmed between 2022 and 2023, where both years are completely reported; the run-rate math suggests it continued into 2024, though the final two years’ numbers should be read as a strong directional signal rather than a precise year-over-year count.
That consolidation is not a one-quarter story — it’s at least a two-year trend, and likely a three-year one. Capital is not leaving the system. It is concentrating into fewer, larger, better-established platforms, while the long tail of smaller first-time and emerging managers is shrinking. For anyone targeting LPs or GPs for a raise, that changes the math: there are fewer doors to knock on than there were two years ago, but the ones still open are opening wider.
How long is the deployment window?
Investment periods vary by strategy, but the disclosed figures in this dataset line up with what most LPAs specify as market standard: a median five-year investment period for private equity and venture capital funds, three years for real estate and private debt vehicles, and four years for infrastructure and multi-strategy funds. The median fund lifespan across the dataset — the point at which a fund is expected to be fully wound down, not just fully invested — is ten years.
Translate that into a calendar using today’s actual date, not the date this data was pulled, and the urgency sharpens considerably. A private equity or venture fund that closed in the first half of 2024 is, on a standard five-year investment period, roughly three years into that clock right now — past the front-loaded years one through three where GPs typically do the bulk of their buying, and entering the back half of the window where remaining capital goes toward follow-ons and reserves rather than new platform investments. A real estate or private debt fund closed in the same window, on a three-year investment period, is in a different position entirely: that window is closing at almost exactly this moment, or has already closed. Most of that $82.3 billion in real estate capital and $131.2 billion in private debt capital closed since January 2024 was supposed to find a home by early-to-mid 2027 — which, from where we sit today, is no longer a distant deadline. It’s next year.
This is the part of “dry powder” commentary that gets lost in headline figures: the money isn’t just available, it’s on a clock, and for real estate and private credit specifically — the strategies most often assumed to move slowest — that clock has nearly run out for the 2024 vintage. A real estate GP sitting on an unspent 2024-vintage fund today is, in a real sense, in more of a hurry than a venture fund in the same position, not less.
Private equity has the money. Venture capital has the volume.
Break the $804.7 billion closed since January 2024 down by asset class and the split is stark.
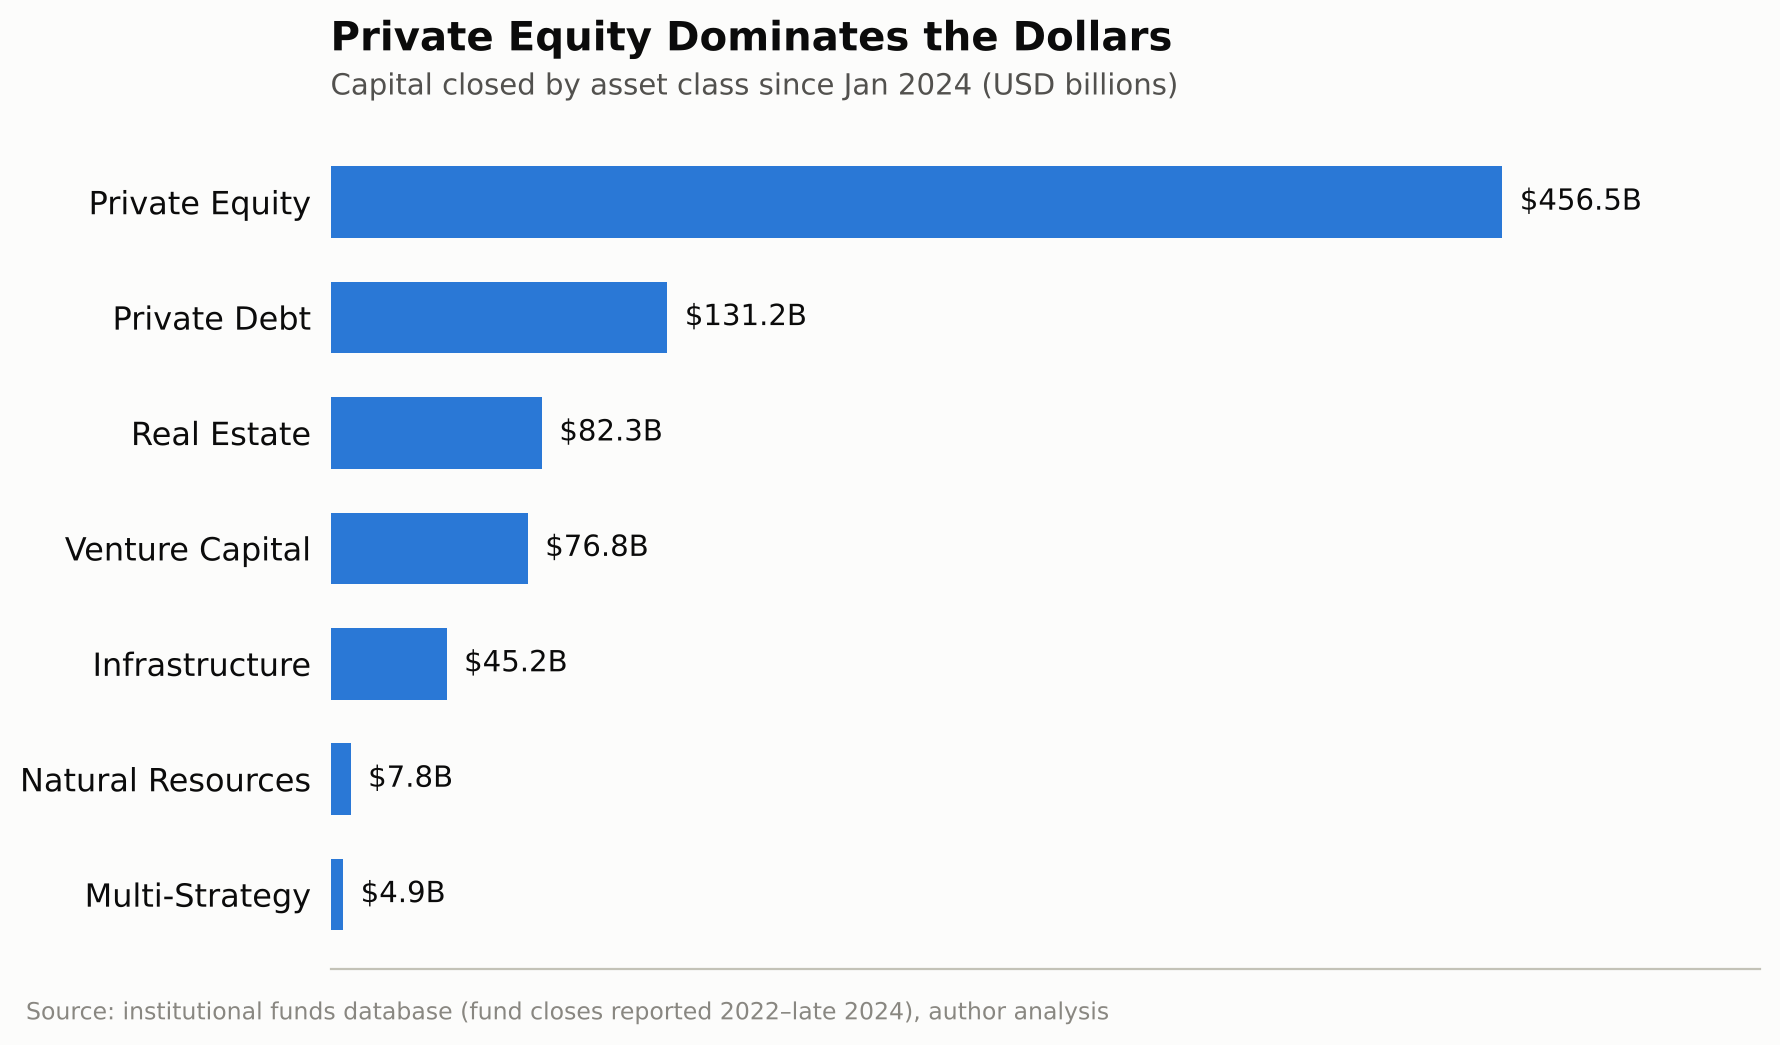
Private equity alone accounts for $456.5 billion — 57% of every dollar that closed — across 624 funds. Private debt is a distant second at $131.2 billion (103 funds), followed by real estate at $82.3 billion (376 funds), venture capital at $76.8 billion (758 funds), and infrastructure at $45.2 billion (40 funds).
Now flip the lens to count instead of dollars, and the ranking inverts almost completely.
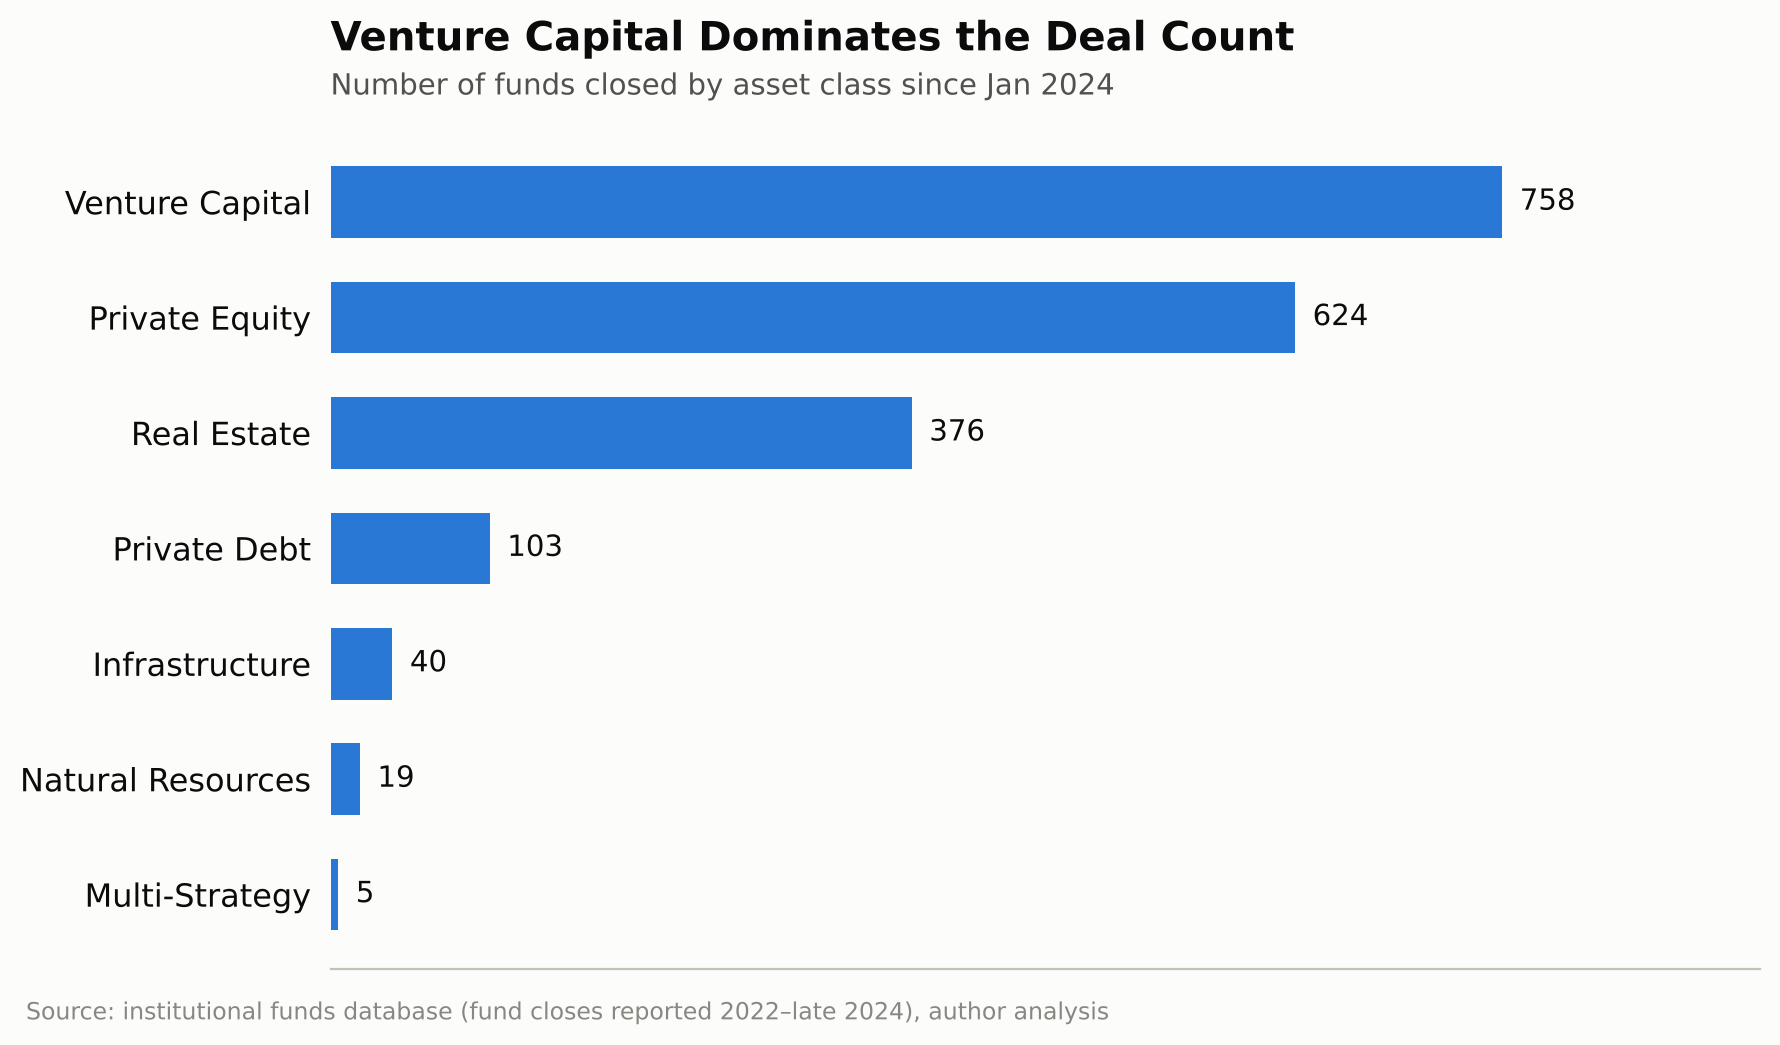
Venture capital is the single largest category by number of funds closed — 758 of them, more than one in every three recent closes — despite accounting for less than a tenth of the dollars. Real estate closed almost as many funds (376) as private equity (624) despite raising a fraction of the capital. The story these two charts tell together: venture is where the volume is; private equity is where the money is. A handful of buyout and growth-equity megafunds are doing most of the dollar-weighted heavy lifting, while venture’s activity is spread across hundreds of smaller, more specialized vehicles.
Within private equity specifically, buyout strategies led the 624 closes (252 funds), followed by growth equity (164), co-investment vehicles (85), funds-of-funds (75) and secondaries (25 primary secondaries funds plus 8 direct-secondaries vehicles). Buyout and growth together account for two-thirds of all PE fund closes since 2024 — the traditional control and expansion-capital playbook is still where the bulk of new PE capital is being raised, even as secondaries and continuation-vehicle strategies continue to get louder press coverage relative to their actual share of new fund formation.
The 85 co-investment vehicles and 75 funds-of-funds are worth a separate mention, because they represent a structurally different kind of capital than a direct buyout or growth fund. Co-investment vehicles exist specifically to deploy alongside a lead sponsor on a deal-by-deal basis — meaning the LPs behind them (often pensions, sovereign wealth funds and large family offices) are actively looking for direct access to specific transactions, not just blind-pool commitments. Funds-of-funds, meanwhile, are themselves LPs — they exist to allocate into other GPs’ vehicles, which makes them a useful, often-overlooked target for emerging and mid-market fund managers currently raising their own fund, as distinct from companies raising operating capital directly.
Within venture capital, the stage breakdown tells its own story: 392 of the 758 VC closes since 2024 were “Venture (General)” funds — multi-stage vehicles without a single declared stage focus — followed by 210 pure early-stage funds, 72 seed funds, 60 start-up-stage funds, and only 16 expansion/late-stage vehicles. Seed and early-stage capital is still where most of the fund count sits, but late-stage and growth-stage venture capital is comparatively scarce — which tracks with what founders raising Series C and beyond have been reporting anecdotally for two years: there are more seed checks being written than there is growth capital to graduate into.
Where the sector-tagged capital is earmarked
Not every fund declares a sector mandate — many PE buyout funds and most real estate vehicles are deliberately sector-agnostic, chasing whatever deal clears their return hurdle. Strip those “Diversified” generalist mandates out and the sector concentration of the capital that does declare a focus is unambiguous.
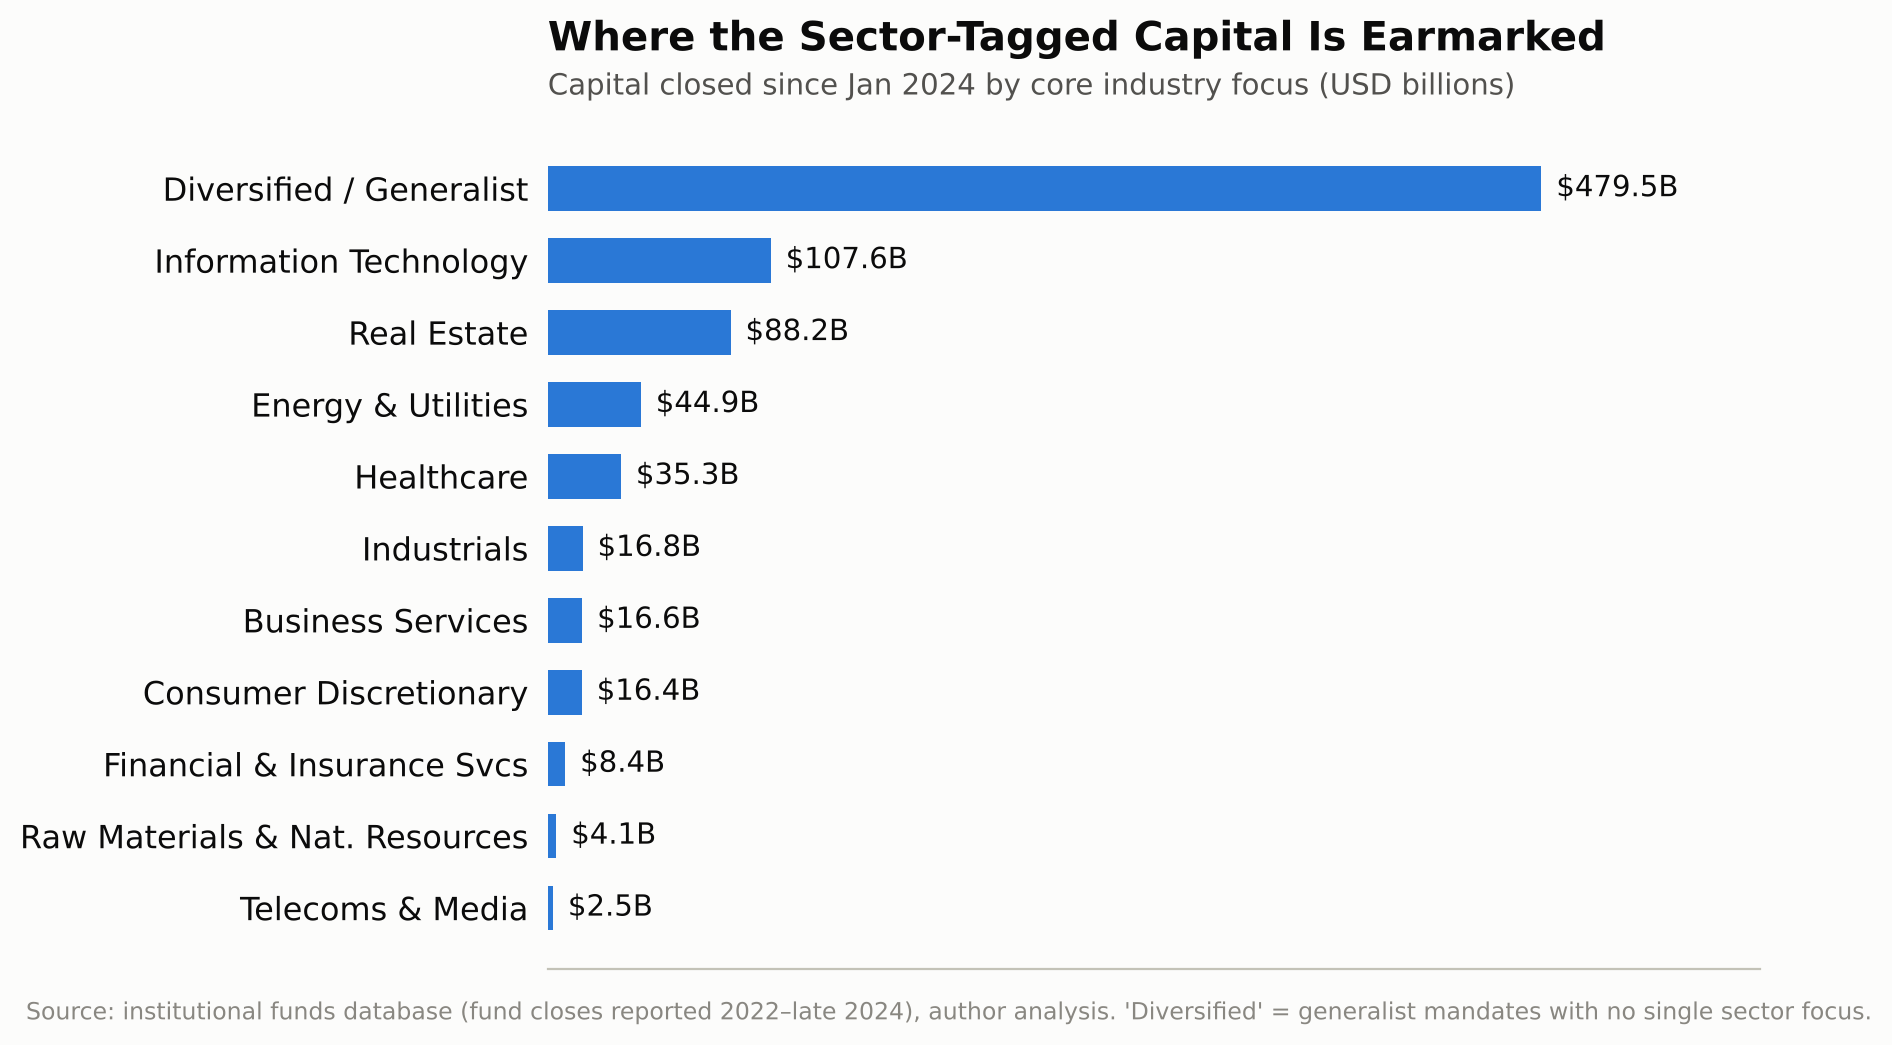
Information technology leads every declared sector at $107.6 billion, followed by real estate-labeled strategies at $88.2 billion, energy & utilities at $44.9 billion, and healthcare at $35.3 billion. Industrials, business services and consumer discretionary each sit in the $16–17 billion range, with financial services, natural resources and telecoms/media trailing.
The $479.5 billion tagged “Diversified” is worth dwelling on rather than discarding. That bucket is dominated by exactly the mega buyout and senior-direct-lending funds in the “largest closes” table further down this piece — EQT X, Vista Equity Partners Fund VIII, New Mountain Partners VII, ICG Senior Debt Partners Fund 5 — platforms explicitly built to be sector-flexible rather than thesis-locked. That’s not a gap in the data; it’s a real feature of how the largest pools of capital are increasingly structured: the bigger the fund, the less likely it is to pre-commit to a single industry before it has seen the deal. The practical implication for anyone targeting these LPs: the biggest checks in the market are the least predictable by sector, and reaching them requires relationship and mandate research — recent deal history, portfolio composition, stated return thresholds — rather than a sector-vertical keyword match against a fund’s marketing material.
Inside venture: AI is no longer a category, it’s the default
Venture capital is the one asset class in this dataset that tags its mandates down to the technology vertical, and the pattern inside those 758 recently-closed VC funds is the sharpest signal in the entire dataset.
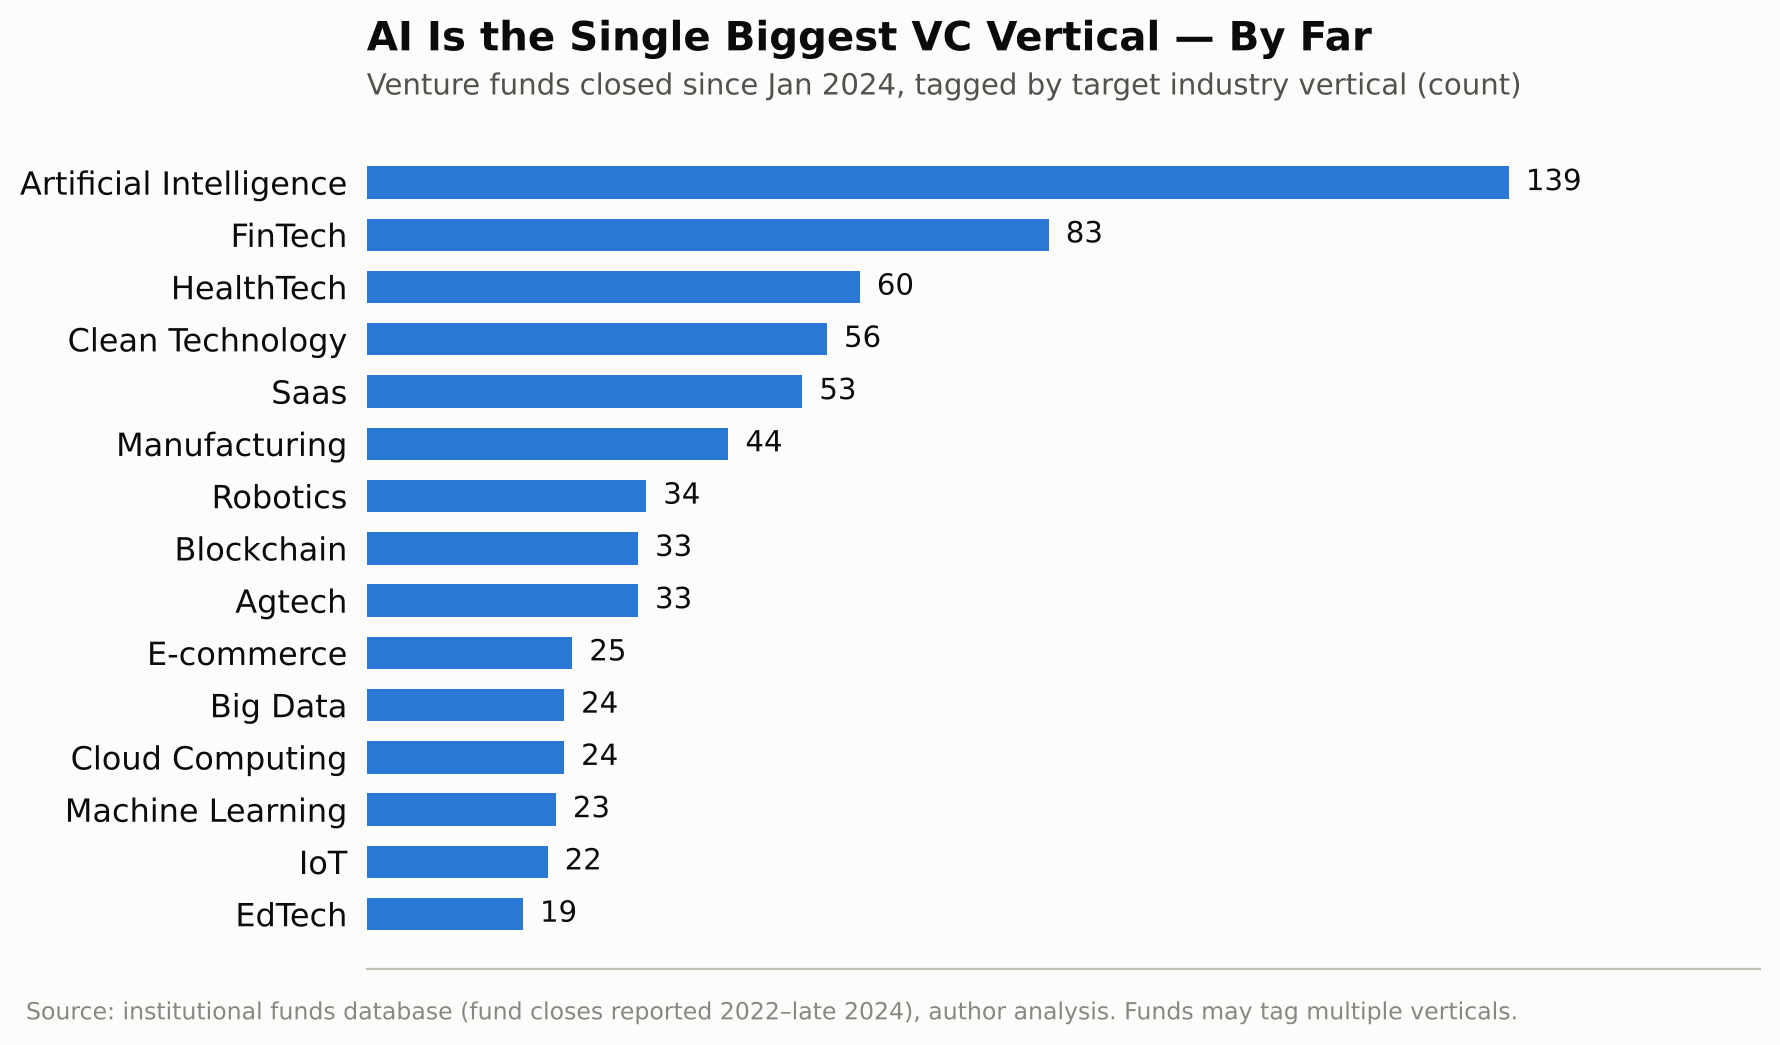
139 of the 758 recently-closed venture funds — better than one in six — list artificial intelligence as a target vertical, more than the next two verticals (FinTech at 83, HealthTech at 60) combined. By dollars, AI-tagged funds account for roughly $28.5 billion of fresh venture capital, again the largest single vertical and nearly double FinTech’s $15.3 billion. Clean technology (56 funds, $8.9 billion), SaaS (53 funds, $9.5 billion) and robotics (34 funds, $3.8 billion) round out the next tier, with blockchain, agtech, big data, e-commerce and cloud computing all clustered in the 22–33 fund range.
Two things are worth noting for anyone pitching into this pool. First, AI’s dominance is now broad rather than narrow — it shows up as a secondary tag across healthcare funds (healthtech + AI), industrial funds (robotics + AI), and fintech funds (AI-driven underwriting and fraud detection) as often as it shows up as a fund’s sole focus. Treating “AI fund” as a distinct, separate category from the rest of the venture market increasingly misses the point: AI has become table stakes across verticals rather than a vertical unto itself. Second, the fund count understates concentration — many of 2024’s largest AI-focused venture closes were the kind of marquee, oversubscribed raises that dominate headlines, while dozens of smaller, generalist-labeled “Venture (General)” funds are quietly writing AI-adjacent checks without ever appearing in an “AI fund” ranking.
Real estate: value-add and residential, not offices
Real estate closed 376 funds totaling $82.3 billion since January 2024, and the strategy mix inside that figure is a clean rebuttal to the “commercial real estate is dead” narrative that dominated headlines through the 2022–2023 rate-hiking cycle.
By primary strategy, value-add led with 128 closed funds, followed by core (116), opportunistic (66), debt-focused vehicles (26) and core-plus (24). By property type, residential and diversified mandates dominate: 200 of the 376 funds declared a diversified property mandate, 89 targeted residential specifically, 30 industrial, 22 niche/alternative property types (data centers, self-storage, student housing), 14 hotels, and only 8 office and 7 retail. Office — the property type that drove most of the “real estate crisis” coverage since 2022 — accounts for barely 2% of recently closed real estate fund count. Capital allocators have not abandoned real estate; they have rotated hard away from office into residential, industrial and value-add repositioning plays where the thesis isn’t dependent on return-to-office policy.
Infrastructure’s center of gravity: renewable energy
Infrastructure is the smallest asset class by fund count in this cohort (40 funds, $45.2 billion since January 2024) but arguably the most thematically concentrated. Of the 40 funds that declared a primary sector, 18 – 45% – are renewable energy vehicles, more than diversified infrastructure funds (12) and conventional energy infrastructure (10) combined. Waste management, transport and utilities-focused infrastructure funds barely register by comparison. If there is one asset class in this dataset where the “energy transition” thesis has fully converted from talking point to fund-formation reality, it’s infrastructure — and the capital behind it, while a smaller slice of the overall pie than PE or VC, is almost singularly thematic.
Private debt: senior, direct, and still the quiet growth story
Private debt closed 103 funds totaling $131.2 billion since January 2024 — smaller than private equity or real estate in dollar terms, but worth flagging because it’s the asset class that has grown most consistently as a share of institutional allocations since rates moved higher in 2022–2023. The strategy mix inside it confirms the market narrative: direct lending (28 funds) and direct lending specifically structured as senior debt (27 funds) together account for more than half of all recent private-debt closes, with special situations (17), mezzanine (15) and distressed debt (10) making up most of the rest. Senior, secured, direct lending — the most conservative point on the private credit risk spectrum — is where the bulk of new private debt capital is concentrated, consistent with LPs treating private credit as a yield-and-downside-protection allocation rather than a hunt for distressed upside.
The twenty largest closes since 2024 read like a who’s-who of global private capital
Zoom in on the single largest individual fund closes since January 2024 and the list is a reminder of how concentrated the top of this market really is — a handful of names most allocators already know, writing checks that dwarf the rest of the market combined.
| Fund | Manager | Asset Class | Strategy | Size (USD) |
|---|---|---|---|---|
| EQT X | EQT | Private Equity | Buyout | $23.8B |
| Silver Lake Partners VII | Silver Lake | Private Equity | Buyout | $20.5B |
| Vista Equity Partners Fund VIII | Vista Equity Partners | Private Equity | Buyout | $20.0B |
| ICG Senior Debt Partners Fund 5 | ICG | Private Debt | Direct Lending — Senior | $16.9B |
| New Mountain Partners VII | New Mountain Capital | Private Equity | Buyout | $15.4B |
| Dover Street XI | HarbourVest Partners | Private Equity | Secondaries | $15.1B |
| Ares Senior Direct Lending Fund III | Ares Management | Private Debt | Direct Lending | $15.0B |
| Cinven VIII | Cinven | Private Equity | Buyout | $14.5B |
| BDT Capital Partners Fund IV | BDT Capital Partners | Private Equity | Buyout | $14.0B |
| West Street Loan Partners V | Goldman Sachs Asset Mgmt | Private Debt | Direct Lending — Senior | $13.1B |
| Apax Partners XI | Apax Partners | Private Equity | Buyout | $12.0B |
| HPS Specialty Loan Fund VI | HPS Investment Partners | Private Debt | Direct Lending — Senior | $10.4B |
These twelve funds alone account for roughly $191 billion — nearly a quarter of the entire $804.7 billion closed globally since January 2024 – concentrated in nine fund managers, seven of them pure buyout shops and three of them senior direct lenders. The pattern holds further down the top twenty: Vitruvian Investment Partners V ($8.1B), Crown Global Secondaries VI ($6.9B), The Resolute Fund VI ($6.9B), CVC Capital Partners Asia Pacific VI ($6.8B), KKR Asia Pacific Infrastructure Investors II ($6.4B), Apollo/Athene Dedicated Investment Program II ($6.0B), Hamilton Lane Secondary Fund VI ($5.6B) and Lone Star Fund XII ($5.3B) round out the list. Buyout, senior direct lending and secondaries are, without much competition, where the biggest single checks in the market are landing.
For context on the rest of the field: natural resources closed 19 funds totaling $7.8 billion since January 2024 — split between energy-focused vehicles (10 funds), agriculture and farmland (5), timberland (3) and metals and mining (1) – and the small “multi-strategy” category closed just five funds totaling $4.9 billion, the largest of which, Mercer Private Investment Partners VII, closed at $3.9 billion. Neither category moves the overall numbers much, but both are useful reminders that “institutional capital” is not a monolith – it spans everything from timberland funds to multi-asset-class platforms, each with a completely different LP base and deployment timeline.
The regional picture: capital is still overwhelmingly North American
Geography is where this dataset delivers its least surprising — but still useful to quantify — finding.
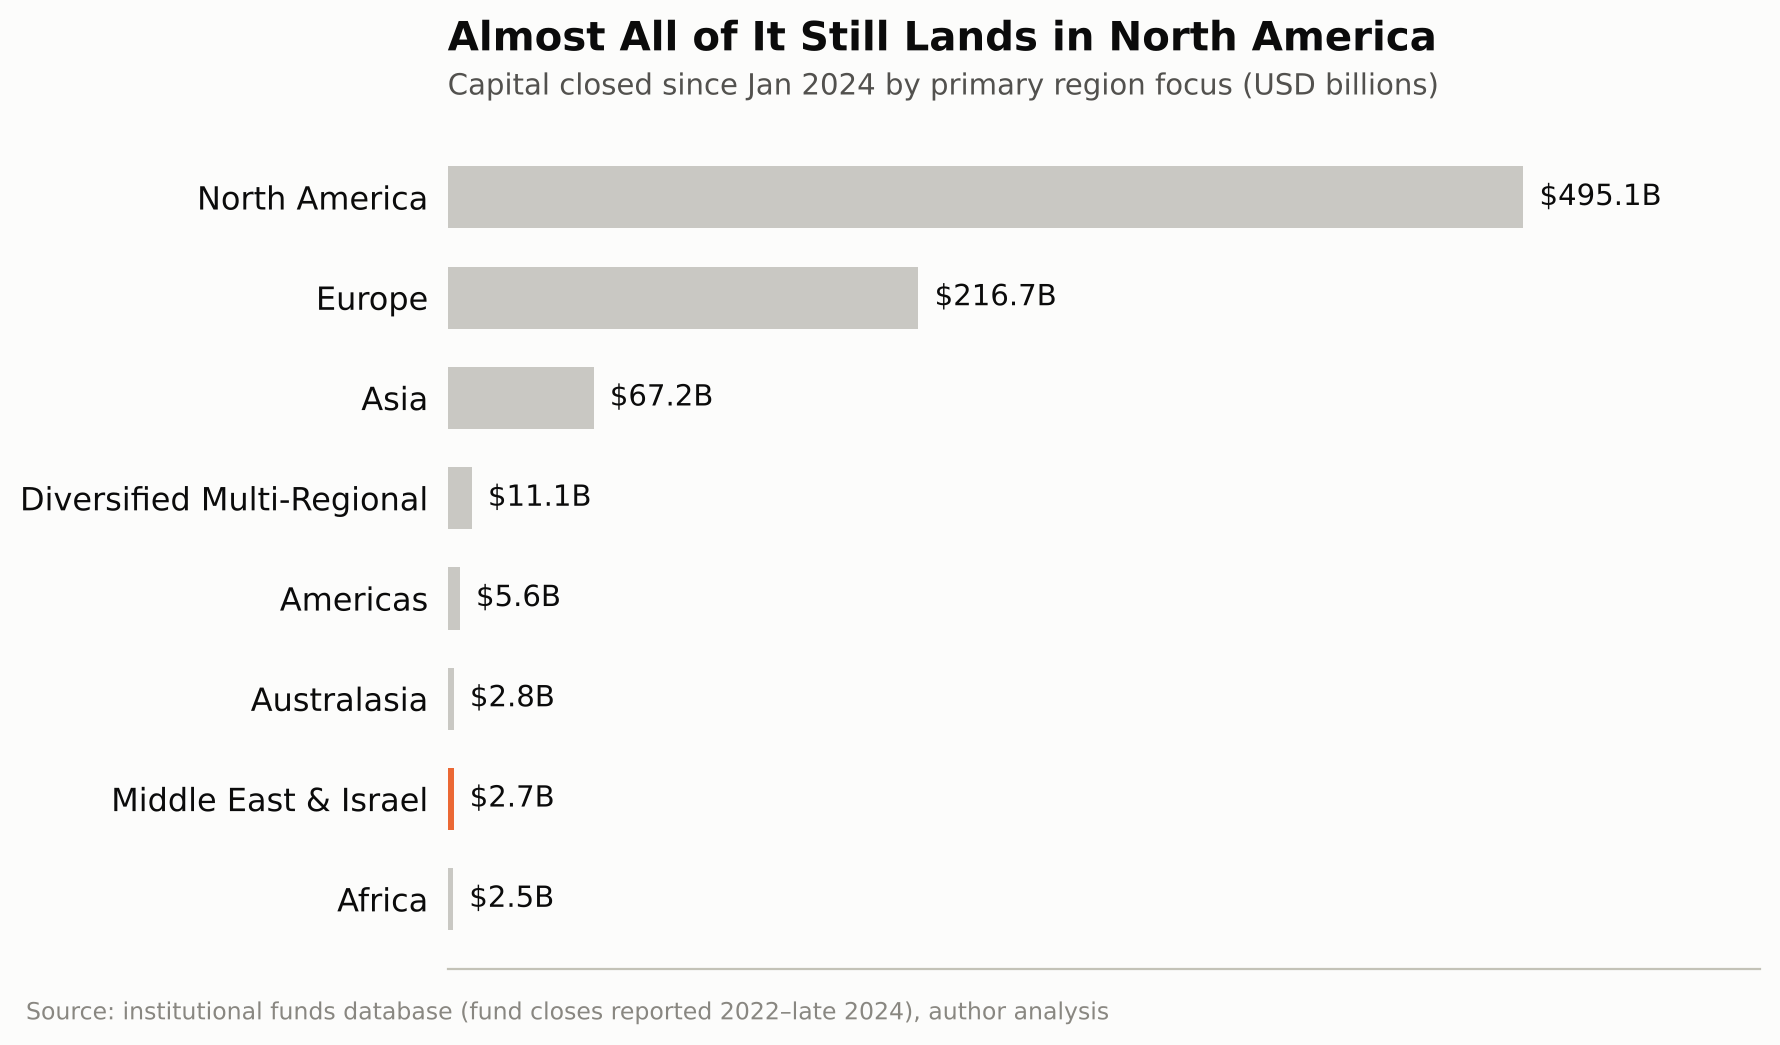
North America-focused funds account for $495.1 billion of the $804.7 billion closed since January 2024 – 61 cents of every dollar – across 1,178 funds. Europe is a distant second at $216.7 billion (317 funds), Asia third at $67.2 billion (303 funds). Everything else – diversified multi-regional mandates, the Americas ex-North America, Australasia, the Middle East & Israel, and Africa – splits the remaining roughly $25 billion between them, each individually in the low single-digit billions.
The Middle East & Israel specifically accounts for just $2.7 billion of primary-focus capital closed since January 2024, across 25 funds – a sliver of the global total. But a sliver of a very large number is still a meaningful, investable pool, and the composition of that regional capital — who’s raising it, for what, and from where – is distinctive enough from the global averages above that it deserves its own treatment. (We’ve broken that cohort down fund-by-fund, including the Israeli, Emirati and Saudi managers behind it, in a companion piece: Who’s Writing the Checks: Fresh UAE & Israeli Tech Capital Closed in 2024.)
It’s also worth flagging that the $2.7 billion figure understates how much global capital is actually mandated to touch the region. Several large, globally-focused funds that closed since January 2024 — including a $2.6 billion General Atlantic vehicle, a $1.9 billion Macquarie real estate fund, and a $1.9 billion Tenex Capital Partners buyout fund — list the Middle East among their secondary geographic exposures even though their primary focus sits in North America or Europe. Regional-focus tags capture dedicated regional funds well; they understate the amount of globally-diversified capital that is also willing to write a Middle East check when the right deal appears.
What this means if you’re raising capital right now
A few practical takeaways fall directly out of the numbers above, for founders, operators and deal teams currently building a target list of LPs or GPs to approach.
Fewer, bigger funds means fewer, bigger relationships matter more. With fund count down roughly 52% since 2022 even as total dollars raised stayed roughly flat, the managers who did close are, on average, sitting on considerably more capital per vehicle than they were two years ago. A targeted list of 40 well-matched, recently-closed funds is more likely to produce a check today than a list of 200 funds was in 2022 — because many of the names on that longer 2022-era list simply didn’t raise a follow-on fund.
“Recently closed” is a better filter than “large AUM.” A fund that closed eighteen months ago with a three-to-five-year investment period is demonstrably still deploying. A fund manager’s total AUM across multiple legacy vehicles tells you much less about whether this year’s capital is actually available — most of that legacy AUM may already be fully committed to older portfolio companies.
Sector-tagged mandates are the minority, not the majority, of dollars. The single largest pool of capital in this dataset — nearly $480 billion — carries no fixed sector mandate at all. For founders and operators outside of AI, fintech, healthtech or clean energy specifically, that generalist capital, not a sector-specific fund, is very often the more realistic target, and it requires a different kind of outreach: thesis and team fit rather than keyword match.
AI fatigue among LPs has not shown up in fund formation yet. Whatever the public debate about an AI bubble, the fund-formation data through 2024 shows no slowdown — AI remains the single largest venture vertical by both fund count and dollars closed, and it increasingly shows up as a secondary tag across healthtech, fintech and industrial-focused funds rather than existing in isolation.
Direct lending’s growth is a credit market story, not a venture or equity one. For founders financing growth with debt rather than equity — particularly in real estate, project finance or asset-backed structures — senior secured direct lending is the single most active corner of the private debt market right now, not distressed or mezzanine strategies.
Co-investment and fund-of-funds vehicles are a distinct target list, not a subset of “PE investors.” A pension or sovereign allocator sitting inside a co-investment vehicle is explicitly looking for direct deal access; a fund-of-funds is itself an LP shopping for GPs to back. Conflating either with a generic “private equity investor” list wastes outreach on the wrong pitch.
Real estate capital has rotated, not retreated. Office-focused fundraising has all but stopped — 8 of 376 recently closed real estate funds by property type — while residential, industrial and value-add repositioning strategies account for the overwhelming majority of new real estate capital. A real estate raise pitched as “diversified commercial” is competing for a much smaller pool than one pitched as residential, logistics or a value-add turnaround — and given how close the 2024 vintage already is to the end of its investment period, any GP still holding uncommitted real estate capital from that vintage needs a deal now, not a thesis.
The takeaway
Roughly $1.1 trillion in institutional capital — closed funds and active interim closes combined — closed in the last fully-reported fundraising cycle, obligated by LPA terms to a three-to-five-year deployment clock that started ticking the day each fund closed. Today, two to three years into that clock, it’s concentrated in fewer managers than it was when the cycle began, tilted hard toward private equity by dollar value and venture capital by deal count, dominated by AI within venture specifically, rotated away from office and toward residential and value-add within real estate, concentrated in senior direct lending within private credit, thematically anchored in renewable energy within infrastructure, overwhelmingly North American by region, and sitting in a nearly-$480-billion generalist pool that doesn’t announce itself by sector at all. A meaningful slice of it — the shorter-duration real estate and private debt capital specifically — is now in its final year of obligated deployment, which makes it more urgent money, not less, than the headline “closed in 2024” framing suggests.
None of that is a forecast. It’s a trail of capital that was already raised, by managers who already made a legal commitment to their own LPs about when it gets deployed, and whose clock is a matter of arithmetic rather than opinion. That’s precisely what makes it more useful than sentiment, headlines, or the next quarter’s fundraising environment commentary — this money exists, it’s identifiable fund by fund, and anyone can work out exactly how much runway each vintage has left.
None of that capital finds a deal by accident. It finds deals because someone on the GP side built — or bought — a targeted map of exactly which LPs, family offices and co-investors fit a specific raise, in a specific sector, at a specific stage. That mapping exercise is exactly what the institutional investor and fund databases we maintain at dubaiinvestorslist.com are built to shortcut: verified contact-level detail on the family offices, funds and institutional allocators actually active in a given sector and region, rather than a generic list scraped from a press release six months after the money was already spoken for.
Frequently asked questions
What does “final close” actually mean, and why does it matter more than “fund size”? A final close is the date a fund stops accepting new LP commitments. Fund managers announce a target size when they launch a raise, but the number that matters for deployment purposes is what they actually closed at — and the date they closed. A fund’s investment period (typically three to six years under its limited partnership agreement) starts running from that close date, which is precisely why “closed since January 2024” is a more useful filter than “large” or “well known”: it tells you which funds are contractually under pressure to deploy right now, rather than which funds happen to be the biggest.
Does a fund that’s “still raising” matter if it hasn’t had a final close yet? Yes, and often more than people assume. A fund in its first or second close has already received capital calls from the LPs who committed at that stage, and most GPs begin sourcing and closing deals well before a final close — both to build a track record for the LPs still being pitched, and because waiting idle on committed capital works against the fund’s own return targets. That’s why this analysis treats recent interim closes ($340 billion worth, as of this writing) as a second, active deployment pool alongside final closes.
Why does “Diversified” show up as the largest sector category? Many of the largest private equity and private credit funds in this market — particularly mega buyout and senior direct lending vehicles — are deliberately built to be sector-agnostic, chasing whatever deal clears their size and return thresholds rather than committing to a single industry upfront. That’s a real, common fund structure, not a data gap. It does mean that targeting those pools of capital by keyword-matching a sector tag won’t work; it requires understanding a specific fund’s actual deal history and current thesis.
Is this specific to any one data provider or methodology? The analysis in this piece draws on fund-level data — size, strategy, close dates, sector and geographic mandate — compiled across more than 24,800 institutional vehicles globally. Figures are presented in USD at the fund’s reported close size; funds with an undisclosed or not-yet-reported close size are excluded from dollar totals (though still counted in fund-count figures where status is known).
How current is this data, and why does the analysis stop at 2024? Fund-close reporting in this dataset runs through late September 2024 and effectively stops there — 2024 is a nine-month year inside this data, not a twelve-month one, and 2025 has almost no reported closes at all. That’s a reporting-lag artifact, not a market signal: fund closes are typically disclosed to data providers with a lag of weeks to several months, large funds in particular often don’t confirm a final close publicly until well after the fact, and whatever extract this analysis draws on was evidently pulled before that lag caught up. Practically, that means two things for how to read this piece. First, every dollar figure and fund count for 2024 is a partial-year number, understated relative to the true full year — we’ve flagged the annualized run-rate estimate where it matters. Second, and more importantly: none of that changes which funds actually closed, what they raised, or what strategy and sector they target — it only means this is a snapshot of the last fully-identifiable fundraising cycle rather than breaking news, and the deployment-clock analysis throughout this piece is built around that fact, not in spite of it. A fund that closed in March 2024 closed in March 2024 regardless of when the data was pulled; what changes with the passage of time is how much of its investment period is left, which is exactly the lens this piece applies throughout.
Data source: http://www.dubaiinvestorslist – a proprietary database of 24,800+ institutional private equity, venture capital, real estate, infrastructure, private debt and natural resources funds, with fund-close reporting from 2022 through late 2024, covering fund size, close dates, strategy, sector and geographic mandate.

